Correlation and Causation Visiting Associate Professor Giddings
530 likes | 770 Vues
Correlation and Causation Visiting Associate Professor Giddings. Math/Econ 108. Outline. A Brief History of Correlation What is Causation? What is Correlation? Spurious Correlations Simpson’s Paradox How scientists determine causation. What is Causation?.

Correlation and Causation Visiting Associate Professor Giddings
E N D
Presentation Transcript
Correlation and CausationVisiting Associate Professor Giddings Math/Econ 108
Outline • A Brief History of Correlation • What is Causation? • What is Correlation? • Spurious Correlations • Simpson’s Paradox • How scientists determine causation
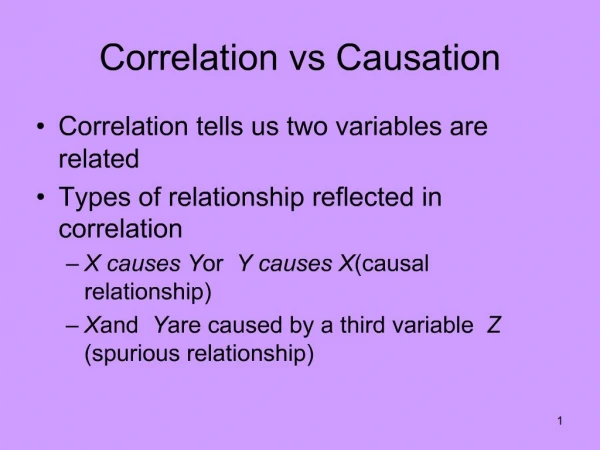
What is Causation? • When changes in one variable (X) affect changes in another variable (Y), we say that X causes Y. • Examples: • The Sun Rises → Rooster Crows (unidirectional) • Education → Higher Wages (bidirectional?)
Important Questions • What causes poverty? • Will Obama’s tax cuts cause the economy to expand? • Does immigration cause lower wages? • Does Prozac cause suicide? • Does the burning of fossil fuel cause global warming?
The Importance of Causality • I would rather discover one causal law than be the King of Persia. • Democritus (460-370 B.C)
How do we determine Causation? • Correlation • Controlled Experiments • Theory
What is Correlation? • When two variables move together, we say they are correlated.
Karl Pearson1857-1936 • Protégé of Sir Francis Galton, he founded the world’s first statistics department at University College London. • Main contributions: • Linear regression an dcorrelation • Classification of distributions • Pearson’s chi-square test • Coefficient of correlation
Pearson’s r • Should be +1 if all points lie on line with a positive slope • Should be -1 if all points lie on line with a negative slope • Should be 0 if all points on horizontal or vertical line
Should be unchanged if the same constant is added to all x-values or all y-values. Put center of graph at
Here’s a different way of seeing it • If r = 1, every X should equal Y. • So, Pearson’s correlation coefficient essentially measures how far the Xs and Ys are from each other.
So, the Crucial Point is… • Correlation does not necessarily imply causality