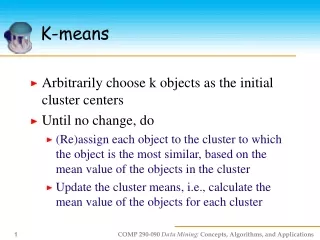
K-Means Algorithm: Properties, Optimization, and Benchmark Datasets
610 likes | 633 Vues
This comprehensive guide covers the properties, optimization steps, and benchmark datasets of the K-means algorithm. It includes information on the goal, assumptions, steps, problems, and benchmarks of K-means, as well as insights into its performance factors, benchmark data sets statistics, and various properties such as overlap, contrast, intrinsic dimensionality, H-index, and distance profiles. If you are looking to deepen your understanding of the K-means algorithm and its applications, this guide provides valuable insights and analysis.

K-Means Algorithm: Properties, Optimization, and Benchmark Datasets
E N D
Presentation Transcript
Pasi Fränti K-means properties 11.10.2017 K-means properties on six clustering benchmark datasets Pasi Fränti and Sami Sieranoja Algorithms, 2017.
Goal of k-means Input N points: X={x1, x2, …, xN} Output partition and k centroids: P={p1, p2, …, pk} C={c1, c2, …, ck} Objective function: SSE = sum-of-squared errors
Goal of k-means Input N points: X={x1, x2, …, xN} Output partition and k centroids: P={p1, p2, …, pk} C={c1, c2, …, ck} Objective function: Assumptions: • SSE is suitable • k is known
K-means algorithm X = Data set C = Cluster centroids P = Partition K-Means(X, C) → (C, P) REPEAT Cprev← C; FOR i=1 TO N DOpi ← FindNearest(xi, C); FOR j=1 TO k DO cj ← Average of xi pi = j; UNTIL C = Cprev Assignment step Centroid step
K-means optimization steps Assignment step: Centroid step:
Problems of k-meansDistance of clusters Cannot move centroids between clusters far away
Problems of k-meansDependency of initial solution Initial solution: After k-means:
K-means performanceHow affected by? 1. Overlap 3. Dimensionality 4. Unbalance of cluster sizes 2. Number of clusters
A1 A2 A3 A sets K=20 K=35 K=50 • Spherical clusters • Number of clusters changing from k=20 to 50 • Subsets of each other: A1 A2 A3. • Other parameters fixed: • Cluster size = 150 • Deviation = 1402 • Overlap = 0.30 • - Dimensionality = 2
overlap increases S sets K=15 Gaussian clusters (few truncated) S S S S 1 2 3 4 9% 41% 22% 44% Least overlap Strong overlap but the clusters still recognizable
Unbalance K=8 Dense clusters Sparse clusters st.dev=2043 st.dev=6637 100 100 Areas well-separated 2000 100 2000 2000 100 100 *Correct clustering can be obtained by minimizing SSE
DIM sets K=16 DIM32 • Well-separated clusters in high-dimensional spaces • Dimensions vary: 32, 64, 128, 256, 512, 1024
G2 Datasets K=2 G2-2-30 G2-2-50 G2-2-70 600,600 500,500 Dataset name: G2-dim-sd Centroid 1: [500,500, ...] Centroid 2: [600,600, ...] Dimensions: 2,4,8,16, ... 1024 St.dev. 10,20,30, ... 100
Birch Birch1 Birch2 Regular 10x10 grid Constant variance offset = 43659 amplitude = -37819 phaseshift = 20.8388 frequency = 0.000004205 y(x) = amplitude * sin(2**frequency*x + phaseshift) + offset
Birch2 subsets B2-random B2-sub N=100 000 k=100 N=99 000 k=99 k=98 N=98 000 N=97 000 k=97 k=96 k=95 …...………….. Random subsampling ….… Cutting off last cluster k=3 N=2 000 k=2 N=1 000 k=1
Measured properties • Overlap • Contrast • Intrinsic dimensionality • H-index • Distance profiles
Misclassification probability Points from blue cluster that are closer to red centroid. Points from red cluster that are closer to blue centroid. Points = 2048 Incorrect = 20 Overlap = 20 / 2048 0.9 %
Overlap Points in blue cluster whose red neigbor is closer than its centroids. Points in red cluster whose blue neighbor is closer than its centroids. Points = 2048 Evidence = 332 Overlap = 332 / 2048 16 % d1 = distance to nearest centroid d2 = distance to 2nd nearest
Intrinsic dimensionality Average of distances Variance of distances Unbalance DIM 0.4 Birch2 Birch1 6.7 - 7.5 2.6 S sets A1 A2 A3 8.3 2.0 2.5 1.5 2.2
H-index Hubness values: 2 0 4 2 Hub 2 2 2 Rank: 1 2 3 4 5 6 7 Hub: 4 2 2 2 2 2 0
Distance profiles • Data that contains clusters tends to have two peaks: • Local distances: distances inside the clusters • Global distances: distances across different clusters A2 A1 A3 S1 S2 S3 S4 Birch1 Birch2 DIM32 Unbalance
Distance profilesG2 datasets G2: dimension increases D=2 D=4 D=8 D=16 D=32 D=1024 G2: overlap increases sd=10 sd=20 sd=30 sd=40 sd=50 sd=60 D=2 sd=10 sd=20 sd=30 sd=40 sd=50 sd=60 D=128
G2 overlap Overlap decreases Overlap increases
G2 contrast Contrast decreases Contrast decreases
G2 Intrinsic dimensionality ID increases (if overlap) ID increases Most significant
G2 H-index H-index increases No change Most significant
Internal measures Sum of squared distances (SSE) Normalized mean square error (nMSE) Approximation ratio ()
External measuresCentroid index P. Fränti, M. Rezaei, Q. Zhao Centroid index: cluster level similarity measure Pattern Recognition 2014 CI=4 Missing centroids Too many centroids
External measuresSuccess rate 17% CI=1 CI=2 CI=1 CI=0 CI=2 CI=2
overlap increases Dependency on overlapS datasets Success rates and CI-values: S S S S 1 2 3 4 3% 11% 12% 26% CI=1.3 CI=0.9 CI=1.8 CI=1.4
Why overlap helps? Overlap = 22% 90 iterations Overlap = 7% 13 iterations
Main observation 1. Overlap Overlap is good!
A1 A2 A3 Clusters increases Dependency on clusters (k)A datasets K=20 K=35 K=50 0% 1% 0% Success: 4.5 2.5 6.6 CI: 13% 13% 13% Relative CI:
Main observation 2. Number of clusters Linear increase with k!
Dimensions increases Dependency on dimensionsDIM datasets 32 64 128 512 1024 256 CI: 3.6 3.5 3.8 3.8 3.9 3.7 0% Success rate:
Dependency on dimensionsG2 datasets Success degrades Success improves
Lack of overlap is the cause! Overlap Correlation: 0.91 Success
Main observation 3. Dimensionality No direct effect!
Effect of unbalanceDIM datasets Success: Average CI: Problem originates from the random initialization. 3.9 0%