Download
1 / 12
120 likes | 130 Vues
Analyzing the levels of PM2.5 particulate matter in Texas, its sources, health effects, and its impact on visibility. Data sourced from TCEQ Texas PM2.5 Monthly 2013 and Texas PM2.5 with Population San Antonio CPS Pecan Valley. Future work involves analyzing temperature and precipitation data. No serious PM2.5 pollution found in Texas.

E N D
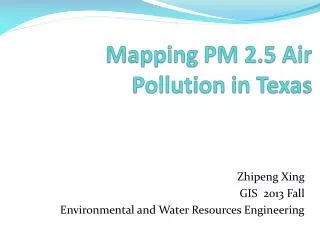
Mapping PM 2.5 Air Pollution in Texas Zhipeng Xing GIS 2013 Fall Environmental and Water Resources Engineering
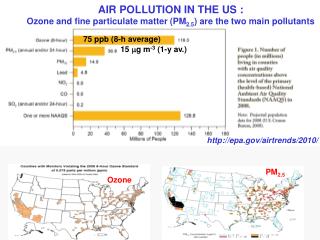
PM 2.5 • Particulate Matter 2.5 um ~ 10 um • Reach into lungs • Irritation • Coughing/sneezing • Asthma/heart disease • Reduced visibility • Sources • Automobile exhausts • Gas/droplets reaction • Cooking/smoking • EPA limit: annual mean 12 μg/m3
Data Source • TCEQ
Conclusion Future Work • High concentration at high population/traffic • Temperature & Precipitation • GOOD NEWS! - No serious PM 2.5 pollution in Texas • Same analysis for the other site • FINISH THE REPORT!!!
Acknowledgement • Dr. Maidment