Download

1 / 35
350 likes | 496 Vues
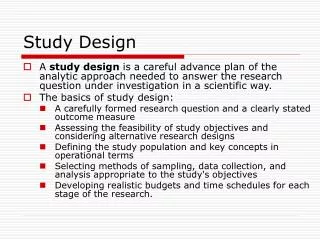
PP (Study Design) for 2 nd Year. Dave Garbera F1 Arrowe Park Hospital. Learning Objectives. Population Measures Study Design Statistical Devices Problems with Analysis Sensitivity, Specificity and Positive Predictive Value. Why PP?.

E N D
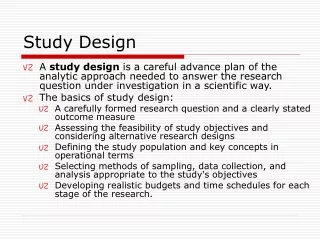
PP (Study Design) for 2nd Year Dave Garbera F1 Arrowe Park Hospital
Learning Objectives • Population Measures • Study Design • Statistical Devices • Problems with Analysis • Sensitivity, Specificity and Positive Predictive Value
Why PP? • Provides a good understanding of the basics of Evidence Based Medicine • Understand study designs, statistics and the strength of evidence • Shows you how best to manage your patient • EXAMS! • Paper 1 (30/150) and Paper 2 (30/100) • Critical Analysis of an article • 4 weeks preparation time
Types of Data • Population Data • Census • Deprivation Index • Birth/Death rates • Health Event Data • Hospital Episode Statistics • National Cancer Register • GP Research Database • This data allows you to assess NEED
Prevalence and Incidence • Prevalence • Number of people in a population with a disease at any given point in time • E.g. The prevalence of asthma in Liverpool now is 40 per 1000 people • Tells you how widespread a disease is • Incidence • New cases of a disease in a given time frame • E.g. The incidence of asthma in Liverpool from 1 January – 31 December 2012 was 5 per 1000 people • Tells you about RISK • When would you see a high prevalence but low incidence and vice versa?
Risk • Absolute Risk • The risk of getting a disease in a given population • E.g. the risk of having an MI in Liverpool is 1 in 50 • Relative Risk • The probability of getting a disease in one group compared to another • Relative Risk = exposed group non-exposed group E.gthe risk of having an MI in smokers is 1/5 and the risk in non-smokers is 1/20, so the relative risk is 4.
Risk Reduction • Absolute Risk Reduction • The reduction in absolute risk when an intervention is applied to a population group • E.g. Introduction of a new drug reduces risk of MI from 20% to 10% • ARR = 10% = 0.1 • Numbers Needed to Treat • The number of people that must be treated using a particular intervention to prevent a bad outcome • 1 / ARR • 1 / 0.1 = 10 • 10 people must be treated with the new drug to prevent one MI
Study Design Hierarchy • Case Report • Case Series • Population Case Series • Cross-sectional Study • Case Control Study • Cohort Study • Randomised Controlled Trial
Observational Studies • Everything except RCT • Case Report • Single case study from one patient • Case Series • Series of single patient reports • Population Case Series • Case series in a defined geographical area
Observational Studies • Cross-sectional Study • Looks at one characteristic at a point in time • Allows calculation of prevalence • Case Control Study • These studies are RETROSPECTIVE • Compares those with the disease to those without • CANNOT PROVE CAUSALITY
Case Control Studies Smoker? Crohn’s Non-smoker? 1980 Present Smoker? Don’t have Crohn’s Non-smoker?
Observational Studies • Cross-sectional Study • Looks at one characteristic at a point in time • Allows calculation of prevalence • Case Control Study • These studies are RETROSPECTIVE • Compares those with the disease to those without • CANNOT PROVE CAUSALITY • Cohort Study • PROSPECTIVE studies • Follow two groups and record outcomes
Cohort Studies Smokers Get Crohn’s Don’t get Crohn’s Present 2020 Non-smokers Get Crohn’s Don’t get Crohn’s
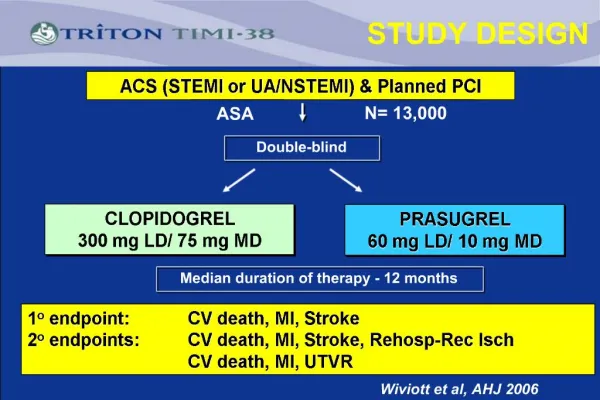
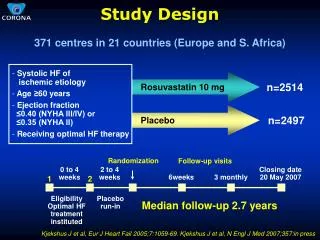
Randomised Controlled Trial • The gold standard • The only trial where YOU intervene • Direct comparison of two standardisedgroups • Control group and interventional group • Most effective when patients researchers don’t know which group is which • BLINDING
Randomised Controlled Trial Group receiving current best treatment Measure mortality rate = 20% Present 2020 Group receiving new experimental treatment Measure mortality rate = 10% Shows that the new drug reduces mortality by 10% (absolute risk reduction)
Measures of Central Tendency • Mean • Useful if all values are similar 50, 51, 53, 53, 54, 56, 56 • Median • Eliminates extreme values 22, 51, 53, 53, 54, 56, 98 • Mode • Analyses peaks in data 22, 22, 22, 51, 53, 98, 98, 98
Standard Deviation • Allows you to see the spread of data • A small SD shows that data is central around the mean and is, therefore, accurate • A large SD shows data dispersion across a range of values and is, therefore, innaccurate • You don’t need to know how to calculate SD!
Statistical Devices • 95% Confidence Intervals • Gives the range of data you are confident the true result lies in • E.g. You expect 50% of the population to vote Labour • 95% CI says the true value lies between 45% and 55% • Student’s t-test • Statistical test to determine how significant the results of a study are • Uses a value known as a p-value • A p-value of less than 0.05 shows statistical significance and demonstrates that the probability the results are due to chance is less than 5% • A value of over 0.05 means study results are invalid
Measures of Risk • Odds • This is a measure of how likely something is to happen • IT IS NOT THE SAME AS PROBABILITY • It describes the chance of something happening versus it not happening • E.g. the probability of rolling a six on a dice is 1 out of 6 • The odds of rolling a dice is 1 out of 5
Odds Ratio • This is the ratio of two odds • It tells you the odds of an event happening in one group compared to the same event in another group • E.g we roll a dice. What is the odds ratio of rolling a six both times? • (1/5) divided by (1/5) = 1 • The odds are the same in both groups
Risk Ratio • This is similar to odds ratio, except probabilities are used • The risk ratio (relative risk) tells you the risk of developing a disease related to a given risk factor • It is calculated by dividing the exposed group by the non-exposed group • If there is no increase in risk, the risk ratio is 1 • E.g. 30 people in the smoker group develop Crohn’s and 6 people in the non-smoker group develop Crohn’s • 30/6 = 5 – You are 5 times more likely to get Crohn’s if you smoke
Important! • Odds ratio is used for case control studies • Relative Risk is used for cohort studies • You cannot use relative risk for case control studies because they do not prove causality, and you cannot, therefore, estimate risk
Bias • Selection Bias • Bias in selecting study participants • Volunteer Bias • Bias when only certain types of people volunteer • Information Bias • Bias resulting from errors in in measurements of data • Recall Bias • Bias created when patients are asked to remember information
Confounders • Factors that may skew results as they correlate with both variables
Sample Size • This is important (and actually quite obvious!) • You cannot draw pertinent conclusions from your data unless the sample size is large enough • This helps to eliminate results that are due to chance • There are ways of working out how large your sample size must be for any given study • Covered in 3rd Year Critical Thinking Module
Error • Type 1 • Finding a difference between two datasets that isn’t really there • Type 2 • Missing a significant difference between two datasets • Due to factors such as bias or chance
Sensitivity and Specificity • Sensitivity • Measures how good a screening test is at identifying TRUE cases of a disease • True positives / True positives + false negatives (x100) • Specificity • Measures how good a screening test is at identifying healthy individuals with no disease • True negatives / True negatives + false positives (x100) • Very subtle difference between the two measurements
Screening method Biopsy Sensitivity = 70 / 70 + 3 = 96% Specificity = 20 / 20 + 7 = 74%
Positive Predictive Value • Tells us how good a diagnostic test is at identifying positive patients • Similar to sensitivity • Represented as a decimal rather than percentage • Calculated by True Positives / All positives • 70 / 77 = 0.91 • A result of 1 would indicate a perfect test • Negative predictive value also works in exactly the same way
Other parts of PP • Bradford-Hill criteria • Wilson and Jugner criteria • Maxwell’s criteria • Impairment, Disability and Handicap • Ecological Fallacy • Utility and Opportunity Cost • Rates • Kaplan-Meier Plots • Prevention Paradox • Case Mix • We can go through these another time if you’d like!