Download
1 / 1

E N D
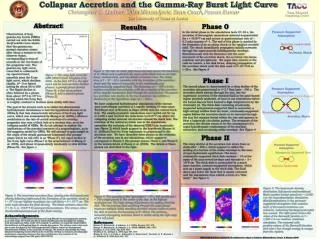
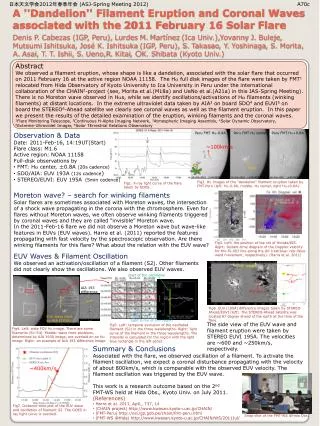
A ''Dandelion'' Filament Eruption and Coronal Waves associated with the 2011 February 16 Solar FlareDenis P. Cabezas (IGP, Peru), Lurdes M. Martínez (Ica Univ.),Yovanny J. Buleje, MutsumiIshitsuka, José K. Ishitsuka (IGP, Peru), S. Takasao, Y. Yoshinaga, S. Morita, A. Asai, T. T. Ishii, S. Ueno,R. Kitai, ○K. Shibata (Kyoto Univ.) 日本天文学会2012年春季年会 (ASJ-Spring Meeting 2012) A70c • Abstract • We observed a filament eruption, whose shape is like a dandelion, associated with the solar flare that occurred on 2011 February 16 at the active region NOAA 11158. The Hafull disk images of the flare were taken by FMT1 relocated from Hida Observatory of Kyoto University to Ica University in Peru under the international collaboration of the CHAIN2-project (see, Morita et al.(M18a) and UeNo et al.(A21a) in this JAS-Spring Meeting). There is no Moreton wave observed in Has, while we identify oscillations/activations of Ha filaments (winking filaments) at distant locations. In the extreme ultraviolet data taken by AIA3 on board SDO4 and EUVI5 on board the STEREO6-Ahead satellite we clearly see coronal waves as well as the filament eruption. In this paper we present the results of the detailed examination of the eruption, winking filaments and the coronal waves. • 1Flare Monitoring Telescope, 2Continuous H-Alpha Imaging Network, 3Atmospheric Imaging Assembly, 4Solar Dynamic Observatory, • 6Extreme-Ultraviolet Imager, 6Solar TErrestrial Relations Observatory • Observation & Data • Date: 2011-Feb-16, 14:19UT(Start) • Flare class: M1.6 • Active region: NOAA 11158 • Full-disk observations by • FMT: Ha center, ±0.8A (20s cadence) • SDO/AIA: EUV 193A (12s cadence) • STEREO/EUVI: EUV 195A (5min cadence) Peru FMT Ha-0.8A Peru FMT Ha center Peru FMT Ha+0.8A ~100km/s flare Fig2. Ha images of the “dandelion” filament eruption taken by FMT-Peru (left: Ha-0.8A, middle: Ha center, right Ha+0.8A). Fig1. X-ray light curve of the flare taken by GOES. Moreton wave? – search for winking filaments Solar flares are sometimes associated with Moreton waves, the intersection of a shock wave propagating in the corona with the chromosphere. Even for flares without Moreton waves, we often observe winking filaments triggered by coronal waves and they are called “invisible” Moreton wave. In the 2011-Feb-16 flare we did not observe a Moreton wave but wave-like features in EUVs (EUV waves). Harra et al. (2011) reported the features propagating with fast velocity by the spectroscopic observation. Are there winking filaments for this flare? What about the relation with the EUV wave? Fig3. Left: the position of the slit of Hinode/EIS. Right: Distant-time diagram of the Doppler velocity for the Fe XIII line along the slit (red/blue: red-/blue-ward movement, respectively). (Harra et al. 2011) EUV Waves & Filament Oscillation We observed an activation/oscillation of a filament (S2). Other filaments did not clearly show the oscillations. We also observed EUV waves. EUV wave start of the oscillation ~87° filament AIA 193 difference Fig6. EUV (195A) difference images taken by STEREO-Ahead/EUVI (left). The STEREO-Ahead satellite was located 87 degree ahead of the earth at the time of the flare. EUV wave front by AIA (193A) light curve of this region The side view of the EUV wave and filament eruption were taken by STEREO EUVI 195A. The velocities are ~600 and ~250km/s, respectively. Fig5. Left: temporal evolution of the oscillated filament (S2) in the three wavelengths. Right: light curve of the filament in the three wavelengths. The intensity is calculated for the region with the light blue rectangle in the left panel. Fig4. Left: wide FOV Ha image. There are some filaments (S1-S4). Middle: wave front positions, determined by AIA 193A image, are overlaid on an Ha image. Right: an example of AIA 193 difference image. • Summary & Conclusions • Associated with the flare, we observed oscillation of a filament. To activate the filament oscillation, we expect a coronal disturbance propagating with the velocity of about 800km/s, which is comparable with the observed EUV velocity. The filament oscillation was triggered by the EUV wave. • This work is a research outcome based on the 2nd • FMT-WS held at Hida Obs., Kyoto Univ. on July 2011. • (References) • Harra et al. 2011, ApJL, 737, L4 • (CHAIN project) http://www.kwasan.kyoto-u.ac.jp/CHAIN/ • (FMT-Peru) http://esi.igp.gob.pe/chain/fmt-peru.html • (FMT-WS @Hida) http://www.kwasan.kyoto-u.ac.jp/CHAIN/WS/2011Jul/ * ~400km/s * Fig7. Distance-time plot of the EUV wave and oscillation of filament S2. The GOES X-ray light curve is overlaid. Snap shot of the FMT-WS @Hida Obs.