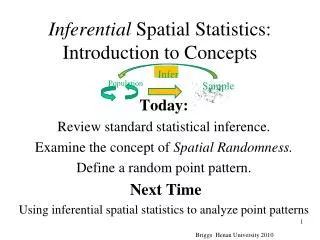
Inferential Spatial Statistics: Introduction to Concepts
Inferential Spatial Statistics: Introduction to Concepts. Infer. Today: Review standard statistical inference. Examine the concept of Spatial Randomness. Define a random point pattern. Next Time Using inferential spatial statistics to analyze point patterns. Population. Sample.

Inferential Spatial Statistics: Introduction to Concepts
E N D
Presentation Transcript
Inferential Spatial Statistics:Introduction to Concepts Infer Today: Review standard statistical inference. Examine the concept of Spatial Randomness. Define a random point pattern. Next Time Using inferential spatial statistics to analyze point patterns Population Sample Briggs Henan University 2010
Spatial Analysis:successive levels of sophistication • Spatial data description: classic GIS capabilities • Spatial queries & measurement, • buffering, map layer overlay • Exploratory Spatial Data Analysis (ESDA): • searching for patterns and possible explanations • GeoVisualization through data graphing and mapping • Descriptive spatial statistics • Spatial statistical analysis and hypothesis testing • Are data “to be expected” or are they “unexpected” relative to some statistical model, usually of a random process • Spatial modeling or prediction • Constructing models (of processes) to predict spatial outcomes (patterns) Briggs Henan University 2010
Descriptive & Inferential Statistical Analysis Last time we discussed descriptive statistics for spatial analysis Concerned with obtaining summary measures to describe a set of data For example, the mean and the standard deviation, the centroid and the standard distance This time we will discuss inferential statistics begin by reviewing standard (non-spatial) inferential statistics then look at inferential spatial statistics Briggs Henan University 2010
Standard Statistical Inference: Inferential statistics • Concerned with making inferences: • from a sample(s) about a population(s) • from observed patterns about underlying processes I hope you are already familiar with standard (non-spatial) inferential statistics. I will quickly review the main ideas. Briggs Henan University 2010
Populations and Samples Sample: a part (subset) of the population for which we have data. The sample is used to make inferences about the population. Population: all occurrences of a particular phenomena You are a sample of the population of all people in the world. Infer We draw conclusions about the population from the sample. Briggs Henan University 2010
From Lecture #2 on Spatial AnalysisProcess, Pattern and Analysis • Often, we cannot observe the process, so we have to infer the process by observing the pattern • From the sample, we infer the process in the population. Infer Population Sample Create Patterns Processes Briggs Henan University 2010
The Importance of the Sample It depends upon the sample! If we get sample, the conclusions are good. Sample is representative of the population If we get sample, the conclusions are not good. Sample is a not representative of the population. How “good “ (or “accurate” or “true”) are our inferences or conclusions? Briggs Henan University 2010
The Requirement of a Random Sample • All statistical inference is based on the assumption (requirement) that you have a random sample • What is a random sample? • A sample chosen such that every member of the population has an equal chance (probability) of being included • Doesn’t guarantee a representative sample • Could be really unlucky and get
Some Definitions • Sample • Subset of population for which we have data • Statistics • Numbers calculated from the sample • Population • All occurences • Parameters • Numbers calculated from the population statistics are estimates of parameters We can calculate the statistic because we have data for samples. We cannot calculate the parameter because we do not have data for entire population. Briggs Henan University 2010
Example: Are girls more intelligent than boys? • Sample of girls • IQ* = 130 • Sample of boys • IQ* = 115 *IQ = Intelligence Quotient Ha! Ha! Girls are more intelligent than boys. Here is the proof! No! No! It depends on the samples we have. The sample statistics are different, but the population parameters may be the same! Who is correct? Briggs Henan University 2010
How do we decide who is correct?The Null Hypothesis and the Alternative Hypothesis Assume that in the population the average (mean) IQ of girls is the same as the average IQ of boys This is called the Null Hypothesis: --there is no difference between girls and boys in the population The Alternative Hypothesis: --in the population, girls are smarter than boys Briggs Henan University 2010
Choosing between Null and Alternative • In our two samples: • The difference between the sample means was 15 • Ask the question: if the population means are the same, how probable is it that, from sampling variation alone, I would get a difference of 15 points between sample means? • If this is reasonable probable (or likely), accept the Null Hypothesis • If this is highly improbable (highly unlikely), reject the Null and accept the Alternative Hypothesis Briggs Henan University 2010
How do I calculate the probability of getting a difference of 15?We use the sampling distribution.What is this? Briggs Henan University 2010
All girls (the population of girls) All boys (the population of boys) Random samples Random samples For every pair of samples, calculate the mean of each, and then the difference between these means. Briggs Henan University 2010
2.5% 2.5% -1.96 0 1.96 The Sampling Distribution If we have a thousand sample pairs, we have a thousand values for We can draw a frequency distribution showing how often or frequently different values occur The sampling distribution is simply the frequency distribution for some value calculated each time from many, many, many samples. The calculated value is called the test statistic Briggs Henan University 2010
2.5% 2.5% -1.96 0 1.96 Using the Sampling Distribution Here, a sample difference of 15 is quite likely: Conclusion: Accept the Null. Boys and Girls are the same 15 15 Here, a sample difference of 15 is very unlikely: Conclusion: Reject the Null Accept the Alternative Girls are smarter than boys The probability should be less than 5% (.05) to reject the null hypothesis. This probability is called the statistical significance of the test. Briggs Henan University 2010
Calculating a Test Statistic • To find the exact probability of getting a difference of 15 between the girls and boys we calculate a test statistic • a test statistic is: a number, calculated from a sample statistic, whose sampling distribution is known • That is, we know the shape of the frequency distribution of the test statistic when multiple samples are taken • In the case of the difference between two sample means the test statistic is: • Note: test statistics always have “degrees of freedom” which are calculated from the sample size (N) It is a Normal Frequency Distribution if the sample sizes are greater than 30. S2g =variance for girls S2b =variance for boys
2.5% 2.5% 1.96 -1.96 0 Test Statistic for Normal Frequency Distribution To reject the Null Hypothesis, the Z test statistic should have a value greater than 1.96 (or less than -1.96). There is less than a 5% chance that, in the population, the means are the same. Conclusion: Reject the Null Accept the Alternative Girls are smarter than boys Briggs Henan University 2010
2.5% 2.5% 1.96 -1.96 Standard Error: Standard Deviation of the Sampling Distribution Smaller standard error Test statistic for the difference between two means: Larger standard error 2.5% 2.5% Standard error for the difference between two means -1.96 1.96 0 • Standard error very important • Approximately, it tells you how far, on average, the sample statistic is away from the population parameter • Thus, it is a measure of sampling variability or error • The larger the standard error, the more difficult it is to reject the Null Hypothesis Briggs Henan University 2010
Reporting the Results of a Statistical Significance Test:many ways to say the same thing! • When we use a test statistic and its sampling distribution we say that we are conducting a statistical significance test • We reject the null hypothesis if there are less than 5 chances in 100 that it is true • We say the results are “statistically significant at the 5% level” • Or we say the results are “significant at the 95% confidence level” Briggs Henan University 2010
2.5% 2.5% -1.96 0 1.96 The Normal or Gaussian Probability Distribution. This is the sampling distribution for tests involving differences between means. Why is it this shape? • If the null hypothesis is true, • what would be the average value of the differences between the sample means? • It would be zero (0) • We expect many small difference values and few big differences • Values would be concentrated around mean • We expect as many negative differences as positive differences • Symmetrical—same on each side of the mean Briggs Henan University 2010
How do we find the Sampling Distribution and Test Statistic? Two methods: • By mathematical theory: • test statistics and sampling distributions already known through theory • common distributions are Z (Normal), Chi-square, and F distributions • By computer simulation • The computer is used to “simulate” multiple samples, and we use these to draw a frequency distribution • As with our “boys and girls” example • Very common in spatial statistics Briggs Henan University 2010
Spatial Statistical Inference Briggs Henan University 2010
Spatial Statistical Inference:Null and Alternative Hypotheses • Null Hypothesis: • The spatial pattern is random • IRP/CSR: independent random process/complete spatial randomness • Alternative Hypothesis: • The spatial pattern is not random • It may be clustered or dispersed Briggs Henan University 2010
What do we mean by spatially random? UNIFORM/DISPERSED CLUSTERED • Random: a point is equally likely to occur at any location, and the position of a point is not affected by the position of any other point. • Uniform: every point is as far from other points as possible: “likely to be distant” • Clustered: every point is close to other points: “likely to be close” RANDOM
Is it Spatially Random?Difficult to know! • Fact: Two times as many people sit “on the corners” rather than opposite at tables in a restaurant • Conclusion: psychological preference for nearness • In actuality: an outcome to be expected from a random process: two ways to sit opposite, but four ways to sit on the corners From O’Sullivan and Unwin p.69 Briggs Henan University 2010
High Peak district biomass index:ratio of remotely sensed data spectral bands B3 and B4 Spatially clustered Geographically random
Why Processes differ from Random Processes differ from random in two primary ways • Variation in the study area • Diseases cluster because people cluster (e.g. cancer) • Cancer cases cluster ‘cos chemical plants cluster • First order effect • Interdependence of the points themselves • Diseases cluster ‘cos people catch them from others who have the disease (colds) • Second order effect In practice, it is very difficult to distinguish these two effects merely by the analysis of spatial data Briggs Henan University 2010
Bank Robberies—First Order or Second Order effect? Bank robbery Banks • Bank robberies are clustered • First order--because banks are clustered Bank Robberies In lecture on Spatial Analysis we called this the effect of “non-uniformity of space” Could there also be a second order effect? Briggs Henan University 2010
Remember our data on software and telecommunications industries in Dallas? We can think of this data as a sample. We can use statistical inference to test if the spatial pattern is clustered, or “random” (no pattern) We will look at the actual tests later. Briggs Henan University 2010
Spatial Statistical Hypothesis Testing: Simulation Approach • Because of the complexity of spatial processes, it is often difficult to derive theoretically a test statistic with known probability distribution • Instead, we often use computer simulations • We take multiple samples from a randomspatial pattern, the spatial statistic we are using is calculated for each sample, and then a frequency distribution is drawn • This simulated sampling distribution is used to measure the probability of obtaining our actual observed spatial statistic Empirical frequency distribution from 500 random patterns (“samples”) Our observed value: --highly unlikely to have occurred if the process was random --conclude that process is not random
Software for Spatial Statistics • ArcGIS 9 The most common GIS Software, but $$$$! • Spatial Statistics Tools for point and polygon analysis • Spatial Analyst tools for density kernel • GeoStatistical Analyst Tools for interpolation of continuous surface data • CrimeStat III download from http://www.icpsr.umich.edu/NACJD/crimestat.html • Standalone package, free for government and education use • Calculates values for spatial statistics but no GIS graphics • Good documentation and explanation of measures and concepts • OpenGeoDA, Geographic Data Analysis by Luc Anselin now at Arizona State • Download from: http://geodacenter.asu.edu/ • Runs on Vista and Windows 7 (also MAC and UNIX) • Earlier version called GeoDA runs only on XP (0.9.5i_6) • Easy to use and has good graphic capabilities • R Open Source statistical package, • originally on UNIX but now has MS Windows version • Has the most extensive set of spatial statistical analyses • Difficult to use • Need to learn it if you are going to do major work in this area • S-Plus the only commercial statistical package with extensive support for spatial statistics • www.insightful.com Briggs Henan University 2010
References • O’Sullivan and Unwin Geographic Information Analysis New York: John Wiley, 1st ed. 2003, 2nd ed. 2010 • Jay Lee and David Wong Statistical Analysis with ArcView GIS New York: Wiley, 1st ed. 2001 (all page references are to this book), 2nd ed. 2005 • Unfortunately, these books are based on old software (Avenue scripts used with ArcView 3.x) and no longer work in the current version of ArcGIS 9 or 10. • Ned Levine and Associates CrimeStat III Washington: National Institutes of Justice, 2010 • Available as pdf • download from: http://www.icpsr.umich.edu/NACJD/crimestat.html • Arthur J. Lembo at http://www.css.cornell.edu/courses/620/css620.html (no longer active) Briggs Henan University 2010
Next time: Inferential Statistics for Point Pattern Analysis Briggs Henan University 2010
Software forSpatial Statistics:Examples Planned as a separate lecture …but we couldn’t meet last Friday …so I will look as some examples after today’s lecture, and again after the next lecture Briggs Henan University 2010
1. Using ArcGIS to find the Population Centroid of China • Open ArcGIS • Add data files: China.shp and ChinaProvinceData.xls • Join ChinaProvinceData.xlx to China,shp • Right click China and select Joins .. • Use GMI_Admin as join field • Open ArcToolbox by clicking on • Go to Spatial Statistics Tools>Measuring Geographic Distribution>Mean Center • Input Feature Class: China • Output: China_MeanCenter.shp • Weight Field: Population 2008 • Note the warning: we should have projected data first! • WARNING 000916: The input feature class does not appear to contain projected data. • It is in south Henan province! Briggs Henan University 2010
2. Calculate Population Centroid using a Spreadsheet Program (e.g. Excel) • Make a copy of ChinaProvinceData.xls and open this copy ChinaProvinceData Copy.xls • It contains Centroids for each province obtained from GeoDA. • (You need the very expensive ArcInfo version to get centroids for all polygons from ArcGIS and I do not have it!) • Calculate: XCentroid * Weight (Population 2008), and then Sum • YCentroid * Weight (Population 2008), and then Sum • Divide each sum by the Sum of the Weights (Total Population 2008). • These are the X and Y coordinates for the China Population Centroid • 113.4696704 32.3797596 • Copy these values into a new worksheet, and create a very simple data table • ID X Y • 1 113.4697 32.3798 • Save spreadsheet and close Excel. • Read this table into ArcGIS • Right click on table name and select Display XY Data • This displays X, Y coordinates from a table on the map. • The results are very similar to the value calculated by ArcGIS itself! Briggs Henan University 2010
3. Use ArcGIS to Calculate Standard Deviation Ellipse for Population and for Illiterate Population • SDE for Population • Go to Spatial Statistics Tools>Measuring Geographic Distribution> • Directional Distribution • Input Feature Class: China • Output: SDE_Population.shp • Weight Field: Data$.Pop2008 • Mean Center for Illiterate Percent • Go to Spatial Statistics Tools>Measuring Geographic Distribution>Mean Center • Input Feature Class: China • Output: MC_Illit_PerCent.shp • Weight Field: Data$.Illiterate_Prcnt • SDE for Illiterate Percent • Go to Spatial Statistics Tools>Measuring Geographic Distribution> • Directional Distribution • Input Feature Class: China • Output: SDE_Illit_PerCent.shp • Weight Field: Data$.Illiterate_Prcnt. Briggs Henan University 2010
4. Use GeoDA to find the Centroids of the Provinces of China (Need ArcInfo to do this in ArcGIS, which is expensive. GeoDA is free. ) --The GeoDA program is on my Web site at: www.utdallas.edu/~briggs or go to http://geodacenter.asu.edu/ --download, unzip, and click the file OpenGeoDA.exe to start the software --it does have some “bugs” so some things may not work or it may crash! --Input the provinces shapefile: File>Open Shape File China.shp --Open the data table: Table>Promotion to see what is there --Create centroids for each province: Options> Add Centroids to Table Place check mark in X coordinates and Y coordinates box, click OK --Go to Table>Promotion to open the table—it has the X and Y centroid coordinates --Save as a new shapefile: Table> Save to Shapefile asChina_Centroids.shp I then opened the China_centroids.dbf (part of the shapefile) file with Excel and copied the centroid values into the ChinaProvincesData.xls spreadsheet. Briggs Henan University 2010