Download
1 / 16
160 likes | 270 Vues
The Flash Flood and Intense Rainfall Experiment (FFaIR) highlights critical lessons learned from analyzing flash flood forecasting challenges. Conducted in July 2013, this initiative emphasized the importance of high-resolution models, probabilistic forecasts, and the integration of hydrologic information for improved accuracy. NOAA statistics show flooding causes approximately $8 billion in damages annually, underscoring the need for effective guidance. Key areas of focus include enhancing QPF forecasts, assessing hydrologic responses, and maximizing the use of ensemble predictions to improve immediate flash flood warnings.

E N D
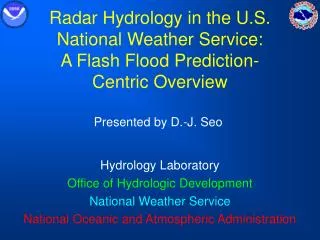
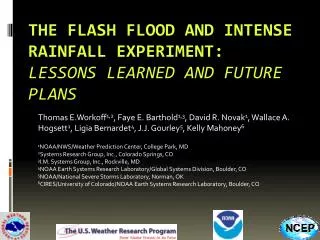
Thomas E.Workoff1,2, Faye E. Barthold1,3, David R. Novak1, Wallace A. Hogsett1, Ligia Bernardet4, J.J. Gourley5, Kelly Mahoney6 1NOAA/NWS/Weather Prediction Center, College Park, MD 2Systems Research Group, Inc., Colorado Springs, CO 3I.M. Systems Group, Inc., Rockville, MD 4NOAA Earth Systems Research Laboratory/Global Systems Division, Boulder, CO 5NOAA/National Severe Storms Laboratory, Norman, OK 6CIRES/University of Colorado/NOAA Earth Systems Research Laboratory, Boulder, CO The Flash Flood and Intense Rainfall Experiment: Lessons Learned and Future Plans
When it Rains, it Pours… • According to NOAA, flooding results in ~$8 billion in damages and ~89 fatalities per year • WPC Excessive Rainfall Product • WPC MetWatch Desk • Responsibility for heavy rainfall mesoscale discussions transferred from SPC to WPC on 9 April 2013 • Mesoscale precipitation discussions • Event driven • Highlight where heavy rainfall may lead to flash flooding in the next 1-6 hours Boulder, 2013 Nashville, 2010
When it Rains, it Pours… • According to NOAA, flooding results in ~$8 billion in damages and ~89 fatalities per year • Excessive Rainfall Products • WPC MetWatch Desk
Flash Flood Forecasting: Challenges • The details of convection are hard to predict • Hires models do well in showing that convection is likely to happen • Struggle with the details • Timing, location, QPF amounts • Hydrologic response is also difficult • How will precipitation be received by the land surface? • Small scale, very sensitive to changes in space • As of now, Flash Flood Guidance (FFG) provides the best way to gauge hydrologic response
Flash Flood Forecasting: Challenges Need to explore techniques to improve short term QPF and flash flood forecasts • What to learn: • The value of hi-res deterministic guidance • The value of probabilistic guidance • Can hi-res ensemble probabilities be helpful in flash flood forecasting? • What needs to be done to maximize the effectiveness of the guidance? • The value hydrologic information • Are flash flood forecasts reliable in the 1-6 hour time frame? 3 hr FFG NSSL’s Flash East ARW
Developing Guidance:How Do we Maximize What we Have? • Use hi-res models to generate probabilistic information to assess flash flood threat Hi-res ensembles can provide a variety of solutions Max 3 hr QPF What if FFG is 2” in 3 hours? .78” 1.4” 2.4” 1.8” 2.3” 2.7” 2.8” 3.7” 4.3”
Developing Guidance:How Do we Maximize What we Have? • Use hi-res models to generate probabilistic information to assess flash flood threat • QPF Probabilities • Couple with FFG: QPF > FFG probabilities Hi-res ensembles can provide a variety of solutions Prob 3 hr QPF > 2” What if FFG is 2” in 3 hours? 0% 0% 57% 0% 42% 71% Is the threat really zero?? 85% 85% 100%
Developing Guidance:Neighborhood Maximum Probabilities • Probability of an event happening within a certain distance of a grid point 0% 0% 57% 0% 42% 71% Probability at this specific grid point 85% 85% 100%
Developing Guidance:Neighborhood Maximum Probabilities • Probability of an event happening within a certain distance of a grid point • Replace the value at a grid point with the maximum value within a radius (e.g. 40 km) 42% 0% 0% 29% 57% 71% 0% 85% 57% 42% 71% 85% Probability within this area 100% 85% 85% 85% 100% 100%
Developing Guidance:Neighborhood Maximum Probabilities • Probability of an event happening within a certain distance of a grid point • Replace the value at a grid point with the maximum value with a radius (e.g. 40 km) 3 hr QPF>FFG 09 UTC 40 km 3 hr QPF>FFG 09 UTC FFW 09 UTC
Flash Flood and Intense Rainfall Experiment (FFaIR): July 8 – 26, 2013 • 26 participants representing operations, research, and academia • 8 remote participants • Daily Activities • 12 hr probabilistic precipitation forecast (12 – 00 UTC) • Probability of exceeding 1” • 6 hr probabilistic flash flood forecast (18 – 00 UTC) • Prelim • Update • 12 hr probabilistic flash flood outlook forecast (00 – 12 UTC) • Subjective Evaluation
FFaIR: Testing and Evaluation • Created QPF exceedance N-hood max probabilities • Storm Scale Ensemble of Opportunity (SSEO) • Experimental Regional Ensemble Forecasting System (ExREF) • QPF > 1” & 3” • QPF > FFG a) SSEO QPF>FFG (point) b) SSEO QPF>FFG (20 km) c) SSEO QPF>FFG (40 km)
FFaIR: Subjective Results 20 km radius most effective for PQPF products, 40 km radius most effective for probability of flash flood (PFFF) products ~94% of Probabilistic Flash Flood (1-6 hr) and Outlook (12 hr) Forecasts were rated as either ‘fair’ or ‘good.’
Lessons Learned: Guidance • High resolution (convection-allowing) guidance can provide valuable information about the potential for flash flooding before event begins • Probabilities of QPF > FFG provide valuable forecast guidance • Neighborhood probabilities can be a particularly useful forecast tool – account for spatial uncertainty in both QPF and hydrologic response • Flash flood guidance is useful for assessing national vulnerability to flash flooding, but has limitations • Different methods used at different RFCs • Data latency due to varying issuance times • Multiple time periods – 1 hr, 3 hr, 6 hr • Complex terrain presents unique challenges Full report available at: http://www.wpc.ncep.noaa.gov/hmt/FFaIR_2013_final_report.pdf
Lessons Learned: Overall • Gap in understanding between the meteorological and hydrologic aspects of flash flood forecasting • Heavy rain ≠ flash flooding • Meteorological confidence ≠ hydrologic confidence • Slight spatial and temporal variations change antecedent conditions, basin response characteristics, etc. • Forecasters successfully able to identify regions with a flash flood threat 6 – 12 hours in advance Full report available at: http://www.wpc.ncep.noaa.gov/hmt/FFaIR_2013_final_report.pdf
Ongoing Work: 2014 FFaIR • We crawled. Now it’s time to walk. • Introduce upgrades to neighborhood probabilities • Reduce the data latency of FFG in QPF > FFG products 06 and 18 UTC cycles • Create exceedance ratios • QPF > .75 FFG • Customize SSEO • Add HRRR as a member(s) • Investigate use of other hi-res guidance • Continue to explore flash flood forecasting beyond the near-term 6 hour period • Explore changes to our Excessive Rainfall Product