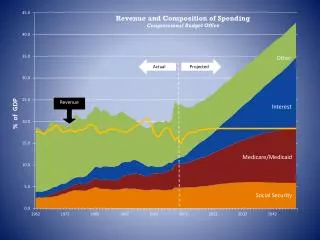
Revenue Prediction
Revenue Prediction. chapter 12. Opening Question. If you managed a restaurant, what information would you want to know to help you predict how many guests to expect at tomorrow’s meal services?. Forecasting Process. Forecasting Process.

Revenue Prediction
E N D
Presentation Transcript
Revenue Prediction • chapter 12
Opening Question If you managed a restaurant, what information would you want to know to help you predict how many guests to expect at tomorrow’s meal services?
Forecasting Process • Historical quantitative data come from POS system or reservation/walk-in book • Qualitative data should be recorded daily in a log or POS system • Qualitative data includes: • weather, • special events, • conventions, • holidays, • construction project, • competition changes, • marketing promotions • …anything that might explain business fluctuations
Trends • Start with customer count from the same day of the week from the prior week or the prior year. • Adjust based on historical trend percent increase or decrease Current customer count– prior count % change = Prior customer count
Example 12a Restaurant saw 347 customers the first Friday in March this year and 360 the first Friday in March last year. What is the percent change from last year? 347-360 % change = = -0.036 (3.6% decrease) 360
Using Trends • Trends only significant if repeated over and over each same day of the week • Manager uses trend to calculate initial forecast New Customer Count = Prior Count X (1 + percent change in decimal form)
Example 12b • New Count = 340 X (1 + 0.014) = 344.8 or 345 Business has consistent trend of 1.4% increase over last year’s customer counts. If first Friday in March last year saw 340 customers, how many should be forecast for the first Friday in March this year?
Rolling Averages • C = Customer count for that period • N = total number of periods counted Use rolling averages when no trend is consistent across weeks. C1 + C2 + C3…+ CN Rolling Average Count = N
Example 12c Business forecasts using rolling averages over 4 weeks. Guest counts for past 4 weeks have been 418, 437, 398, and 414. What is forecast for upcoming week? 418 + 437 + 398 + 414 Rolling Average = = 417 4
Adjusting for Qualitative Data • Manager adjusts initial forecast based on qualitative data • Keep adjusting as new data comes in (weather report changes, for example) • Forecast 1-2 weeks our for schedule, 2-3 days out for ordering, 1 day out for kitchen production schedule
Evaluating the System Constantly compare the forecast to the actual guest count to learn from mistakes and to make more accurate forecasts in the future.
Forecasting Sales • Converting customers to revenue helps to budget and control costs • Average Check = amount of revenue the average person generates on a check • Can calculate average check by server to identify strong servers or average check by day, week, or meal period to inform when to offer promotions
Average Check Revenue for a Period = Average Check Guests for that Period
Example 12d • Average Check = • $12,385 ÷ 1,104 • = $11.22 Over past 4 Mondays, restaurant has served total of 1,104 guests for lunch and brought in $12,385 from those 4 periods. What is average guest check for Monday lunch during this period?
Uses for Average Check • It is a control tool. If it changes much over time, manager should research why and correct problems or reinforce results • When seating is limited, increasing average check may be only way to improve profit • Average check can forecast revenue Forecast Revenue = Forecast Guests X Average Check
Example 12e • Forecast revenue = • 3,700 X $47.58 • = $176,046 Restaurant with average check of $47.58 forecasts 3,700 guests next month. How much revenue should manager expect next month?
Using Forecast Revenue Using forecast revenue and target food cost %, beverage cost %, and labor cost %, manager can determine budget in dollars for a given period of time.
Seat Turnover When seating is maxed out, manager can serve more customers in a period by increasing the seat turnover or number of customers per seat in a given period. Customers Served in a Period = Seat Turnover Total Seats in Dining Room
Example 12f • Seat Turnover = 280 ÷ 120 = 2.33 Restaurant has 120 seats in dining room, but serves 280 guests at dinner. What is seat turnover for dinner?
Seat Turnover (cont.) • Impacted by slow kitchen service or understaffed or slow dining room staff • Guest service should not be so rushed that it reduces check average; service must remain efficient but comfortable for guests • Seat turnover can be used with forecast to decide how many (if multiple) dining rooms to open or when to expand dining room
Menu Mix • Menu Mix % = % of sales that come from each menu item • It is usually divided by menu category and is relatively consistent with a meal period across same days of the week • Caveat: may change seasonally or with weather, and definitely with menu change
Menu Mix Formula • Note: Number of each item sold and total sold come from POS system or sales receipts Number of that item sold = Menu Mix % Total number of items sold
Example 12g • Menu Mix % • = 37 ÷ 140 • = 0.264 or 26.4% Restaurant typically sells 140 desserts each Monday. Of those, 37 are usually sorbet. What percent of desserts are the sorbets?
Menu Mix (cont.) • Menu mix usually calculated against total in a menu category • Manager must calculate % of guests who purchase food from each menu category Guests buying that category = % buying category Total guests
Example 12h • % buying dessert • = 140 ÷ 330 • = 0.424 or 42.4% Of the 330 guests in a restaurant one night, only 140 buy dessert. What percent bought dessert?
Forecasting Number of Menu Items Sold from Menu Mix Percents Step 1
Forecasting Number of Menu Items Sold from Menu Mix Percents Step 2
Example 12i • No. ordering dessert = 370 X 0.42 = 155.4 • No. of sorbets = 155.4 X 0.37 = 57.5 or 58 sorbets Historically, 42% of guests order dessert Thursday night. Of those, 37% are sorbet. How many sorbets should the pastry chef plan for next Thursday if the guest forecast is 370 guests?
Forecasting Kitchen Production • Manager uses forecast menu mix sales to plan kitchen production • Manager should adjust forecast based on qualitative data, desire to have a buffer, or desire to run out of certain foods to avoid leftovers. • Accurate production schedule minimizes leftovers, waste, purchases, and labor costs
Menu Analysis for Increased Profitability • Making the most profitable items the most popular ones helps to maximize overall profit • Menu Analysis is best done over a long time period (several months or a year) Menu Analysis isprocess through which managers compare each menu item’s profitability and popularity
Calculating Popularity Work with only one menu category at a time…
Calculating Profitability, Part 1 Contribution = Item Sales Price – Item Food (or Margin (CM) Beverage) Cost Menu CM = No. sold (for an item) X CM (for that item)
Calculating Profitability • Still working with only one menu category at a time…
Using Menu Analysis • To make an item more popular: move its location on the menu or suggestive sell it. • To make an item more profitable: adjust its portion size or sales price. • Can always rework a menu item or replace it entirely
Reconciling Kitchen Production with Sales • Kitchen production schedules can be used to reconcile food produced against food sold. • All food prepared by kitchen must be accounted for to protect against theft. • Kitchen Production Sheet uses menu mix % and forecast to predict how many of each dish will be sold.
Example 12j • Number ordering dessert • =130 X 0.42 • = 54.6 or 55 guests ordering dessert Restaurant forecasts 130 guests for dinner tomorrow. 42% of guests usually order dessert. Use chart on next slide to calculate the number of each dessert forecast to be sold.
Converting Forecast Menu Mix Count to Kitchen Production Schedule
Kitchen Production Sheet See Table 12.3 in the Text.
Kitchen Production Sheet See Table 12.3 in the Text.
Kitchen Production Sheet Notes • If kitchen runs out of food and additional portions are made during service, “additional production” should be recorded on the form • If a dish is 86’ed, manager should record when this occurs to determine if it represents good or bad forecasting
Mishaps and Sales Reconciliation • When no errors occur during service, dishes sold = number available for sale – leftovers • Errors often occur and should be recorded on a Food Mishap Report a.k.a. Void Sheet • Void Sheet lists all items rendered unusable during service; for each item lost, it includes • the name of server, • item name, • reason for void, • and possibly check number, date, and time of mishap
Voids • Every void must be accounted for to ensure it isn’t being stolen • Trusted employee or manager should verify (visually) that each item is legitimately ruined before entering it on Void Sheet Voids occur when food is dropped on floor, customer rejects it for improper cooking, customer dislikes the taste, or cook ruins it and removes it from circulation
Voids Reasons for voids: • Lots of a voids coming from a single employee suggest the employee needs retraining • Lots of voids across the staff may suggest an understaffed business
Food and Sales Reconciliation Form • At end of service or day, manager should complete a food and sales reconciliation form to confirm that all portions prepared by kitchen are accounted for as sales, voids, or leftovers. See Table 12.5 in text, which shows sample food and sales reconciliation form.