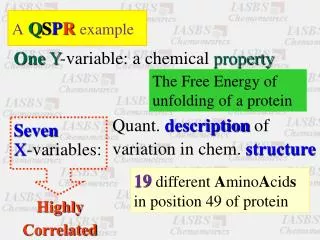
Analysis of GSE9412 Gene Expression Data: Volcano Plot Visualization
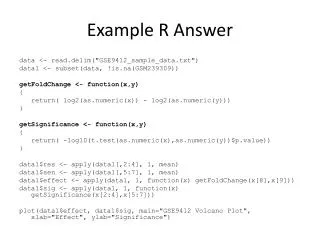
This script performs a comprehensive analysis of GSE9412 sample data using R. It reads the sample data, filters out missing values, and calculates fold changes and significance for gene expressions. The results are then summarized and visualized in a volcano plot, showcasing the relationship between effect size and significance. The script employs functions to compute log2 transformations, t-test p-values, and mean values across specified columns, providing insights into the differentially expressed genes.

Analysis of GSE9412 Gene Expression Data: Volcano Plot Visualization
E N D
Presentation Transcript
Example R Answer data <- read.delim("GSE9412_sample_data.txt") data1 <- subset(data, !is.na(GSM239309)) getFoldChange <- function(x,y) { return( log2(as.numeric(x)) - log2(as.numeric(y))) } getSignificance <- function(x,y) { return( -log10(t.test(as.numeric(x),as.numeric(y))$p.value)) } data1$res <- apply(data1[,2:4], 1, mean) data1$sen <- apply(data1[,5:7], 1, mean) data1$effect <- apply(data1, 1, function(x) getFoldChange(x[8],x[9])) data1$sig <- apply(data1, 1, function(x) getSignificance(x[2:4],x[5:7])) plot(data1$effect, data1$sig, main="GSE9412 Volcano Plot", xlab="Effect", ylab="Significance")
One point about plots From : http://xkcd.com/833/