Download
1 / 30
300 likes | 403 Vues
Develop and test sample and plot designs for estimating riparian attributes. Collaboration with EPA and other agencies. Comparison of data sets. Methods used for sampling, data collection, and analysis are detailed.

E N D
National Riparian Monitoring Protocol Development-John Day Basin Pilot Mary Manning, Vicente Monleon, Marc Coles-Ritchie, Paul Ringold
Purpose • Due to the small area and narrow linear features of most riparian systems west of the Mississippi River, many riparian systems are undersampled using the FIA grid and the definition of forest land use. • There are boundary problems, definition problems, specific problems to riparian area.
Partners • EPA Environmental Monitoring and Assessment Program (EMAP) Western Ecology Divison (WED-RM) • Oregon Department of Environmental Quality (DEQ) • USFS Pacfish/Infish Biological Opinion Effectiveness Monitoring Team (PIBO).
Objectives 1) Develop and test a sample design and two plot designs for the purpose of estimating riparian attributes. This includes condition and extent. 2) Collaborate with other agencies who collect instream, hydrologic and vegetative data (particularly those federal programs, such as EPA EMAP, that use probabilistic sampling). 3) Compare data sets and information. Consider sample objectives and plot design.
Methods • Sites were selected from a spatially balanced sample from the 1:100,000 USGS stream layer (Tony Olsen design). Co-located with EPA/OR DEQ • Two modified P3 plot designs were tested: 1) circular and 2) rectangular subplots- both types placed end to end, and aligned perpendicular to the stream. • All P3 variables were measured in both plot designs. (Lichen and soils not collected)
Methods (cont.) • PNW FIA crew sampled 37 EMAP sites. EMAP WED-RM provided stream reach sampling locations and vegetation data from the same sites. • WED-RM sampled the sites using modified and enhanced EMAP Surface Waters PHab sampling protocols, which include reach level vegetation sampling in addition to stream and floodplain sampling.
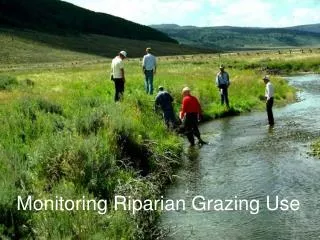
Methods (cont.) • PIBO sampled 23 reaches using their riparian vegetation protocols: • Greenline and valley cross section transects (to augment the P3 plot data to characterize riparian extent, composition, structure and function).
-----------Stream Corridor ------------------------ (Smith and Hellmund 1993)
(Sparks 1995) --------------------------------Forman’s Stream Corridor-------------------------------- Riparian ecotonesare three dimensional areas of interaction that include terrestrial and aquatic ecosystems, that extend down into the groundwater, up above the canopy, outward across the floodplain, and up the near slopes that drain to the water, laterally into the terrestrial ecosystem and along the watercourse at a variable width (adapted from Ilhardt et al. 2000) Even if we have a definition, delineating and aggregating riparian resources is fraught with application problems and conceptual errors.
Biscuit Brook in the Catskills 100 feet Floodprone Bankfull Ok, but how do we tally trees, fish, soils, and other stuff?
stream Suggested FIA Phase 3 Riparian plot cluster Standard FIA P2/3 plot cluster Great, but what about the trees and sedges below the bankfull elevation of the stream? Some mapping protocols map them, and they do perform sediment trapping and channel forming functions
Tree sampling designs require a minimum of 120 to 123 feet of distance from the stream to produce statistically valid data. (the sample plots must be bigger than at least two trees). stream Standard FIA Phase 2 plot cluster Suggested FIA Phase 3 Riparian plot cluster
Edge of subplot at greenline or bankfull, whichever is closest to stream Circular Plot Design
Rectangular Plot Design Edge of subplot at greenline or bankfull, whichever is closest to the stream 3 ft 16.5ft 16.5ft
Initial Questions • Do data from the three methods produce similar lists of plant species for each reach? • Does the species composition of a given reach differ based on data collected using the different methods? • How do sample objectives differ??
Do data from the three methods produce similar values for metrics? • Species richness, evenness, diversity • Wetland Ranking (PIBO) • Ratio of invasives/natives – Index of Alien Invasiveness—EMAP procedure-develop invasiveness rank for each species
Considerations • Are there significant differences in any of these metrics among the methods? • Evaluate selected variables for normality. • If differences exist, is this due to method, (and timing of sampling) or to differences in sampling scale, or both?
Preliminary Results • Challenges with species code and data standardization. • Analysis based on subset of EMAP WP and FIA data—along 15 m from stream edge (full PIBO data set) • Analysis considers different sampling objectives and sample size.
Average # of species
Richness Comparison 170 300
What is the wetland index? • Characterizes vegetation according to Wetland Indicator Status • Generates value between 1 and 100
What does the wetland index indicate? The wetland index is ecologically important because it reflects: • Hydrology • Moisture availability which determines habitat critical to plants and animals • Bank-holding capacity • Studies have documented that riparian communities that grow in wetter environment have greater root length and density (Dunaway et al. 1994, Kleinfelder et al. 1992, Manning et al. 1989, & Toledo & Kauffman 2001)
How the wetland index can be used? • Assess differences between groups or pairs of sites. • Managed vs. minimally managed • Exclosures vs. outside exclosure • Track changes at individual sites, or groups of sites. • Identify relationships between vegetation, environment, management, and stream channel variables. Observer variability needs to be considered because it affects the ability to detect changes.
Limitations of the data set • Using the EMAP sample frame, the scope of inference: federal lands adjacent to permanent, wadeable streams. • Doesn’t include large rivers or intermittent and ephemeral streams • Unlike most studies, we use a probabilistic sample rather than a convenience (purposive) sample.