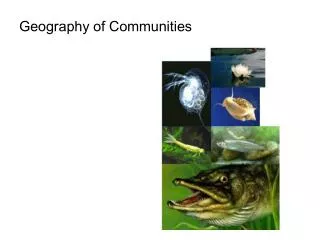
Geography of Communities
800 likes | 1.34k Vues
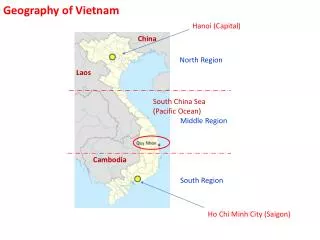
Geography of Communities. Often, groups of unrelated species will show similar distribution patterns. Spruces, kinglets, and red-backed voles are all found in coniferous forests that spread across the northern part of North America and extend to the south at high elevations.

Geography of Communities
E N D
Presentation Transcript
Often, groups of unrelated species will show similar distribution patterns. Spruces, kinglets, and red-backed voles are all found in coniferous forests that spread across the northern part of North America and extend to the south at high elevations.
Species occur together in assocations known as ecological communities. The nature of these associations was a subject debate for much of the 20th Century. Many of the earliest community ecologists studied plant associations. F.E. Clements compared the community to a “superorganism”, with its own life and structure.
Community – an assemblage of different species living together in the same place, typically interacting with one another. Ecosystem – an assemblage of organisms considered together with the physical factors acting upon them.
Ecologists study two primary aspects about communities: Community structure – includng composition, biomass, diversity, etc. Community function – movement of energy through the system, changes over time, etc.
Two characteristics of species that impact their effect on community organization are their: Body mass Trophic status The larger an organism, the more energy it takes to maintain it. Basal metabolic rate (m) varies with body mass (M) according to the relationship: with the constant c varying somewhat among taxonomic groups.
Since the exponent is less than 1, this means that the mass-specific metabolic needs (per unit of mass) are greater for small organisms than for larger ones. A mouse needs about 25 times more energy per gram of body mass than an elephant.
Body size is significant in that it influences the scale at which organisms interact with the environment. Since small organisms use fewer resources, they can utilize smaller areas and specialize on more specific resources, yet still maintain population densities high enough to avoid extinction. They can subdivide the environment more finely.
An examination of frequency distribution of the number of species relative to body size for different animal groups reveals the following: There is a general pattern of small species being more numerous than larger ones (note the logarithmic scale). There are many more species of smaller organisms (like insects) than larger organisms (like birds and mammals).
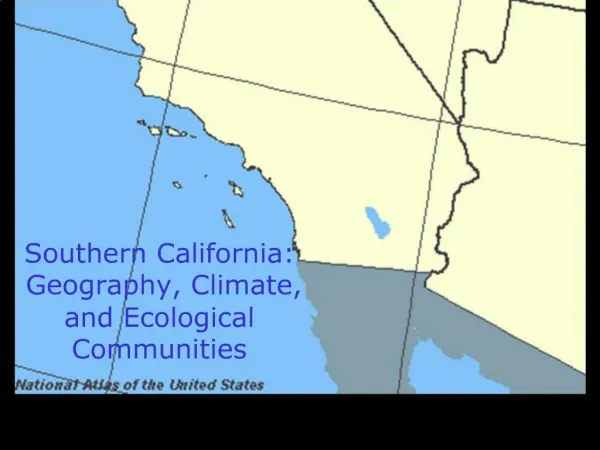
Large animals must have broad geographic ranges. They require more space, and a larger area of the environment is required to provide the resources they need. Mountain lion range in California
A depiction of the geographic range and body mass among North American terrestrial mammals. In general, larger mammals require a larger home range. The areas of the smallest rangest ranges are smaller for herbivores.
Trophic status refers to the manner by which they acquire energy. This also influences the role they play in community structure. For virtually all organisms, the ultimate source of energy is the sun.
Food chains are made up of trophic levels. Quarternary consumer (third-level carnivore) Tertiary consumer (second-level carnivore) Secondary consumer (first-level carnivore) Primary consumer (herbivore) Primary producer
Most communities have more complex trophic relationships that are illustrated as a “food web”.
The laws of thermodynamics come into play in the consideration of food chains. First law of thermodynamics – energy is neither created nor destroyed, but may be converted from one form into another. Second law of thermodynamics – as energy is converted from one form to another, its capacity to do work is diminished and entropy increases (in other words, the process is imperfect – there is a loss of energy at each step). Most animals are able to incorporate a very small percentage of the energy they ingest. The efficiency of transfer is often less than 10%. This means that less energy is available at successively higher trophic levels. This can be illustrated in the form of ecological pyramids (next slide).
Since the carrying capacity of an area is lower for successively higher trophic levels, predictions can be made about their ecological roles and geographic distributions. There are fewer species of carnivores than of herbivores and plants. Carnivores tend to be larger and more generalized than herbivores. Carnivores typically have to be large enough to overpower their prey. Carnivores tend to be generalists in their prey selection. Carnivores tend to have broad geographic ranges.
Distribution of Communities in Space and Time The distribution of species along environmental gradients can differ greatly depending on the nature of the species and the nature of the gradient. The study of such patterns, known as coenoclines, has resulted in a number of hypotheses about how communities transition from one to another.
Groups of species exhibit similar ranges along the gradient and are distributed as discrete communities. • Individual species abruptly exclude one another along sharp boundaries, but most species are not associated in discrete communities. • Species form discrete communities, but replacement of these communities along a gradient is gradual. • Individual species gradually appear and disappear, independent of other species. Species replacement along a gradient is random. There are no discrete communities. • Ranges of most species are nested within the ranges of a few dominant species. Five Hypothetical Coenoclines
Actual coenoclines showing the distributions of tree species along two moisture gradients. In these cases, species replacement is gradual and seemingly independent of one another. This corresponds to pattern D in the previous figure. However, there are some who believe this may be an artifact resulting from the manner in which the data was collected.
Elevational distribution of three-needled (A) and five-needled (B) pines on the western slopes of the Sierra Nevada. Similar species show little overlap in elevation. There also seems to be some degree of community organization.
Ecological succession is the progressive change in community structure and function over ecological time. In short, one assemblage is replaced over time by another assemblage. Succession is a normal process in any system in which disturbance eliminates entire communities. If the substrate is removed and the community must start “from scratch”, we call it primary succession. If the soil remains, it is known as secondary succession. Primary Succession Secondary Succession
We can also examine paleoecological records. Pollen analysis lets us look at the historical distribution of tree species. We can see that distribution of beech and hemlock were considerably further south after the Pleistocene glaciation (~10,000 years ago).
A climograph is a way of examining the relationship of terrestrial biomes to two critical environmental factors, mean annual temperature and mean annual precipitation.
Climate diagrams provide similar information. These diagrams were developed by Heinrich Walter to help examine the relationship between climate and terrestrial vegetation. They summarize much climatic information. With some practice, a glance at a climate diagram can give an overview of a location’s climate.
Tropical Rain Forests Tropical rain forests are found near the equator in three primary regions: Southeast Asia, West Africa, and South and Central America. Most rain forest occurs within 10º of latitude north or south of the equator. The distribution of rain forest corresponds to areas where conditions are warm and wet year-round. Temperatures vary little from month to month. They are not extremely hot. Average temperatures are typically from 25 º to 27 º C. Annual rainfall ranges from 2000 to 4000 mm
Tropical rain forest soils are typically poor, as heavy rains leach nutrients and rapid decomposition keeps soil organics low. Rain forest plants are adapted to conserving nutrients. They often make use of mutualistic relationships with fungi associated with their roots. These relationships are known as mycorrhizae.
Epiphyte mat in rain forest canopy Life in tropical rain forests is very much three-dimensional
Tropical Dry Forest These forests are typically found between 10º and 25º latitude. The climate here is more seasonal than in rain forests. The dry season lasts 6-7 months, followed by a wet season of heavy rains. There is also more seasonal variation in temperature than is seen in the tropical rain forest.Soils in tropical dry forests are usually less acidic and more nutrient-rich than those in rain forests. Highly vulnerable to erosion during the wet season.
Plant and animal life in the dry forest is tightly linked to cycle of dry and wet seasons. Trees in wet regions tend to be taller than those in dry regions. In addition, trees in wet regions may be evergreen, while those in dry regions typically lose their leaves during the dry season. Many animal species are shared with the rain forest. These include monkeys, parrots, and jaguars in South America. Many animals migrate to wetter habitats during the dry season.
Tropical Savanna Found between 10º and 20º latitude. Found in Africa, South America, Australia, and parts of Asia. Alternating wet and dry seasons, but drier than tropical dry forest. Seasonal droughts combine with another important ecological feature….fire. Fires kill young trees while grasses survive and resprout. Soil layers have low permeability. Retain water near surface. Maintains enough water in surface soils to support grasses in dry areas. In wetter areas, trees cannot move onto savannas because the surface soil is waterlogged in the wet season.
Savannas landscapes are somewhat 2-dimensional. Trees are present, but much of the biological activity takes place at ground level.
Desert Occupy about 20% of the earth’s surface. Most are found are 30º latitude. Correspond to regions of descending, dry, subtropical air. Other deserts are found in the interior of continents or in the rain shadow of mountains. Environmental conditions vary. Some deserts actually receive significant rainfall. However, water loss through evaporation and transpiration exceeds precipitation during most of the year. Soils are low in organic material, and are classified as lithisols. May have high salt concentrations.
Plant cover is absent from many places. Where present, it is sparse. Often gray-green in color, because of protective covering. Desert plants show adaptations to prevent water loss. Animal abundance tends to be low, but diversity can be high. Many animals are adapted to deal with environmental extremes.
Temperate Shrubland and Woodland Occur on all continents except Antarctica. Most extensive around the Mediterranean and in western North America. Most are found between 30º and 40º degrees latitude. Cool and moist during the fall, winter, and spring. Summers hot and dry. Frost danger varies, but frosts are not often severe. Fire is frequent and intense. Soils are of relatively low fertility and are fragile. Erosion threat can be increased by fire.
Organisms are adapted for drought. Trees and shrubs typically evergreen with small, waxy leaves. Fire-selected plants dominate. Animals are highly diverse. Includes many migratory birds and insects. Native browsers include deer, wild sheep, antelope, and kangaroos.
Temperate Grassland Largest biome in North America (Great Plains). Even more extensive in Eurasia. In southern hemisphere, found in South American and New Zealand. Receive between 300 and 1000 mm of precipitation annually. Most in the summer. Shorter growing season than more tropical climates. Best grassland soils are deep, nonacidic, and rich in organics.