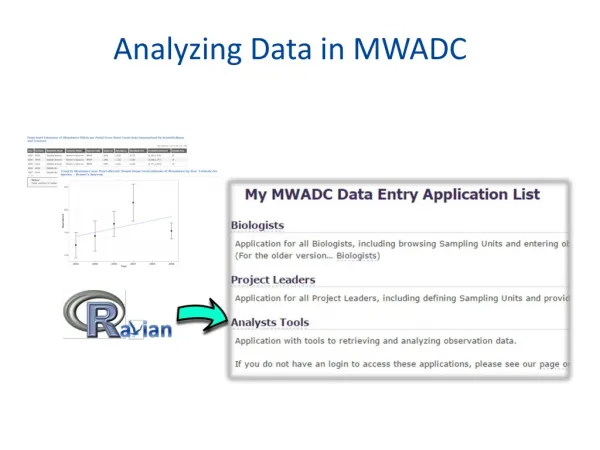
Analyzing Data in MWADC
This guide provides an in-depth analysis of the Ravian server-based analysis package and the Analyst application designed for visualizing AKN data. It covers access to the Analyst, advanced analytical techniques, and the ability to develop custom analyses and visualizations in MWADC. Users will learn to navigate the Analyst dashboard, apply advanced analyses, estimate species density and richness, and develop their own unique applications through the integration of R programming. This resource aims to empower project leaders and researchers in data management and visualization.

Analyzing Data in MWADC
E N D
Presentation Transcript
Outline • What is Ravian and what is the Analyst application? • Accessing the Analyst application • What you can do with the Analyst role? • Advanced analyses in MWADC • Developing your own analyses and visualizations in MWADC
What is Ravian? • Ravian is a server-based analysis package for visualizing AKN data • Developed by Point Blue Conservation Science in the open-source statistical programming language R • Uses warehoused data (known type and characteristics data, apples-to-apples) • Three main levels of use: fixed pre-designed analyses, flexible exploration and analysis development, and advanced analyses
What is the Analyst? • The Analyst is a user interface for simple data visualizations using Ravian • Designed for project leaders and people with some knowledge about the data • Password-protected access • Intended to help develop project reports
Step 8: Analyze Observations Assign Protocols and/or Create New Protocols Add Events and Observations Create a Project Create Sampling Units • http://data.prbo.org/apps/analysts • Segregated by data collection methodology. Add Researchers and/or Have People Register Proof Events and Observations Analyze Observations Assign AKN Data Sharing Level x
Working with the AnalystDashboard Change projects Filter by month and year Filter by distance Select locations Exclude fly-overs Filter by visits Select one or multiple taxa
Working with the AnalystDashboard • Other features include: • Setting, saving and using taxon groups or guilds(obtain results for a guild as a single estimate) • Setting, saving and using customized selection of locations(e.g., remove points from transect before requesting a transect estimate) • Setting, saving and using observation groups(e.g., compare observations in marsh habitat vs. transition habitat) • Download warehouse data (for DIY analysts out there)
Working with the AnalystData summaries Results are downloadable • Basic summaries include: • Descriptions of survey effort(numbers and dates of visits to each location) • Description of observations(number of detections by month and year, by taxa and month/year) • Hill series diversity indices for the entire set (richenss, Shannon, Simpson, evenness)
Working with the AnalystDensity and abundance estimation • Simple density estimation • (average among visits to points/plots/nets and within transects/banding stations – error estimates are good approximations but underesimated) • Tabular and graphic results • Trend estimation (linear and GAM plots)
Working with the AnalystRichness estimation • Simple richness estimation • (average among visits to points/plots/nets and within transects/banding stations – error estimates are good approximations but underesimated) • Tabular and graphic results • Trend estimation (linear and GAM plots)
Advanced analyses in MWADCGeek alert! What? Advanced analyses, required periodically (e.g., annually) for specific purposes (adaptive mgt.) • How? • Use your R interface to request data • Develop your analysis methods • Post the methods in MWADC • Use your R interface to run them • Get results via e-mail Example above fits a BUGS/JAGS model…
Developing your own applicationsGeek alert! • Next iteration of Ravian will allow sourcing of “wrapper” code. • You could then: • Download your sample data from Analyst warehouses • Write your own analysis methods • Encapsulate them in a wrapper function to be sourced by Ravian • Post the wrapper in MWADC • Develop (or let us help you develop) a user interface to use your methods • Results will be displayed on-line in a browser, with all the features of Analyst results (dynamic, downloadable tables, downloadable graphs) • Results can be converted to javascript by Ravian.