Download
1 / 26
260 likes | 425 Vues
Akinori Ito Contents 1. Introduction 2. Biomass burning emissions from 1998 to 2005 Historical biomass burning emissions 4. Historical land-use change emissions. Research at Nagoya University.

E N D
Akinori Ito • Contents • 1. Introduction • 2. Biomass burning emissions from 1998 to 2005 • Historical biomass burning emissions • 4. Historical land-use change emissions
Research at Nagoya University 1) Ito, A., S. Yamada, T. Higuchi, Y. Ishikawa, Y. Nagata, K. Chiba, H. Haraguchi (2002), Recent decline of atmospheric concentration and emission of methane in Nagoya metropolitan area, Bulletin of the Chemical Society of Japan, 75 (11), 2385-2391. 2) Higuchi, T., S. Yamada, A. Ito, Y. Nagata, K. Chiba, T. Sakai, H. Haraguchi (2002), Influences of urban heat island phenomena on carbon dioxide and methane concentrations in urban atmosphere (Nagoya city), Environmental Science, 15 (4), 253-262. 3) Matsunani, A., F. Akimoto, I. Kodama, Y. Kamata, K. Kitagawa, N. Arai, T. Higuchi, A. Ito, H. Haraguchi (2001), Continuous monitoring of nitrogen oxide concentration in urban atmosphere and cross correlation with other greenhouse gases, Bunseki Kagaku, 50 (12), 845-853. 4) Ito, A., I. Takahashi, Y. Nagata, K. Chiba, H. Haraguchi (2001), Spatial and temporal characteristics of urban atmospheric methane in Nagoya City, Japan: An assessment of the contribution from regional landfills, Atmospheric Environment, 35 (18), 3137-3144. 5) Ito, A., I. Takahashi, Y. Nagata, K. Chiba, H. Haraguchi (2000), The long-term evolutions and the regional characteristics of atmospheric methane concentrations in Nagoya, 1983-1997, Science of the Total Environment, 263 (1-3), 37-45. 6) Itoh, A., I. Takahashi, Y. Nagata, H. Sawatari, K. Chiba, H. Haraguchi (1999), Relationship between smog layer formation and concentration variation of methane in urban atmosphere of Nagoya, Chikyukagaku (Geochemistry), 33, 55-64. 7) Itoh A., M. Tomida, I. Takahashi, Y. Nagata, M. Aikawa, H. Sawatari, H. Haraguchi (1998). Analysis of kinetic behaviors of the methane concentration in urban atmosphere of Nagoya, Environmental Science, 11 (3), 283-289.
Research at the University of Michigan 1) Ito, A., S. Sillman, and J. E. Penner (2007), Global atmospheric chemistry modeling studies of tropospheric ozone and non-methane volatile organic compounds, J. Geophys. Res., doi:10.1029/2006JD006556, in press. 2) L. Rotstayn, W. Cai, M. Dix, G. Farquhar, Y. Feng, P. Ginoux, M. Herzog, A. Ito, J. Penner, M. Roderick, M. Wang (2007), Have Australian Rainfall and Cloudiness Increased Due to the Remote Effects of Asian Anthropogenic Aerosols?, J. Geophys. Res., doi:10.1029/2006JD007712. 3) F. Dentener, S. Kinne, T. Bond, O. Boucher, J. Cofala, S. Generoso, P. Ginoux, S. Gong, J. J. Hoelzemann, A. Ito, L. Marelli, J. E. Penner, J.-P. Putaud, C. Textor, M. Schulz, G. R. van der Werf, J. Wilson (2006), Emissions of primary aerosol and precursor gases in the years 2000 and 1750, prescribed data-sets for AeroCom, Atmos. Chem. Phys., 6, 4321-4344. 4) T. J. Wallington, M. D. Hurley, J. Xia, D. J. Wuebbles, S. Sillman, A. Ito, J. E. Penner, D. A. Ellis, J. Martin, S. A. Mabury, O. J. Nielsen, M. P. Sulbaek Andersen (2006), Formation of C7F15COOH (PFOA) and other Perfluorocarboxylic acids (PFCAs) during the Atmospheric Oxidation of 8:2 Fluorotelomer Alcohol (n-C8F17CH2CH2OH), Environ. Sci. Technol., 40(3), 924-930. 5) Ito, A., and J. E. Penner (2005), Estimates of CO emissions from open biomass burning in southern Africa for the year 2000, J. Geophys. Res., 110, D19306, doi:10.1029/2004JD005347. 6) Ito, A., and J. E. Penner (2005), Historical emissions of carbonaceous aerosols from biomass and fossil fuel burning for the period 1870–2000, Global Biogeochem. Cycles, 19, GB2028, doi:10.1029/2004GB002374. 7) Ito, A., and J. E. Penner (2004), Global estimates of biomass burning emissions from satellite imagery for the year 2000, Journal of Geophysical Research, 109, D14S05, doi:10.1029/2003JD004423.
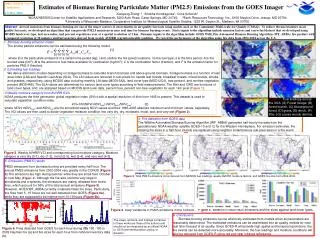
Seasonal and Interannual Variations in CO and BC Emissions From Open Biomass Burning in Southern Africa From 1998 to 2005 ○Akinori Ito, Akihiko Ito and Hajime Akimoto Global Biogeochemical Cycles, in press
Background Satellite information of burned areas and fire countshave been applied to global estimates of open biomass burning emissions [e.g., van der Werf et al., 2003;Ito and Penner, 2004], while satellite-based burned area products are currently under development [e.g., Carmona-Moreno et al., 2005;Roy et al., 2005; Plummer et al., 2006]. However, Swap et al. [2003] pointed out the apparent contradictory of the results between the commonly held understanding maximum burning seasons of August and September in the Southern Hemisphere Africa and the satellite measurements of burned areas. Uncertainty of the burned area estimatesis significantly large without a quantitative validation and calibration using high resolution data [e.g., Kasischke et al., 2003; Boschetti et al., 2004]. Seasonal variations in the BC emissions are also controlled by the available biomass for combustion and the fire characteristics.
Methods MODIS burned area for a calibration of fire counts. Ito and Penner [2005] showed that the estimated ranges from modeling approaches for CO emissions using the MODIS burned area product [Roy et al., 2002] were within the range of the estimates constrained by chemical transport models and the MOPITT measurements for the year 2000 [Arellano et al., 2004; Pétron et al., 2004]. Simulation model of Carbon cYCle in Land Ecosystems (Sim-CYCLE) [Ito and Oikawa, 2002; Ito et al., 2006]for a seasonal variation of fuel load. van der Werf et al. [2003] used a biogeochemical model to represent the seasonality in the delivery of leaves to the litter pools. NDVI data for a seasonal variation of combustion and emission factors. Korontzi [2005] used the NDVI data to represent the temporal and spatial variations of the regional fuel moisture condition, and related them to the combustion factor and the emission factor. Incorporating the seasonal variations of burned areas with fuel load, combustion factor, and emission factor at a fine resolution may improve the mismatch of 1-2 month.
Comparison of CO emissions for 2000 Top-down estimates Arellano et al. [2006] Pétron et al. [2006] Bottom-up estimates This work van der Werf et al. [2006] The peak in CO emissions during open biomass burning season for 2000 is identical to those from top-down estimates using the MOPITT data.
Comparison of BC emissions for 2000 Bottom-up estimates Top-down estimates van der Werf et al. [2006] Penner et al. [2004] This work The peak in BC emissions during open biomass burning season for 2000 is identical to those from top-down estimates using the TOMS AI data.
Sensitivity of Tropospheric Ozone and its Radiative Forcing to Emissions from Biomass Burning ○Akinori Ito, Kengo Sudo, Hajime Akimoto Sanford Sillman, and Joyce E. Penner
Background Ozone in the troposphere Pollutant near the surface and greenhouse gas. Tropospheric ozone increase due to anthropogenic emissions. Radiative forcing: 0.36 ± 0.07 W m‑2 [Gauss et al., 2006]. Biomass burning: Significant sources of trace gases on a global scale. Assumption in modeling studies [Crutzen and Zimmermann, 1991]: Pre-industrial open biomass burning = 10% of present-day estimate. Three historical emission data sets of van Aardenne et al. [2001], Ito and Penner [2005a], and Mouillot et al. [2006]: Significant pre-industrial open biomass burning emissions. Lamarque et al. [2005] found the tropospheric ozone burden increase: 88 Tg with the conventional assumption. 71 Tg with the van Aardenne et al. [2001] inventory. Shindell et al. [2006] estimated adjusted radiative forcing: 0.34 W m‑2.
Methods CHASER model [Sudo et al., 2002]. • Data sets (global averages of radiative forcing (W m‑2 )). • Conventional assumption [Crutzen and Zimmermann, 1991] (0.47): Present: Hao et al. [1990] and Bouwman et al. [1997]. Past:10% of present-day estimate. • van Aardenne et al. [2001] (0.40): Present: Hao et al. [1990]. Past: Rural population as a surrogate for emission changes. • Ito and Penner [2005] (0.42): Present: Ito and Penner [2004] constrained by Arellano et al. [2004]. Past: Satellite data from the TOMS AI data and land-use change. • Mouillot et al. [2006] (0.41): Global fire map [Mouillot and Field, 2005] and CASA carbon cycle model [Potter et al., 1993].
Surface O3 concentrations (ppbv) in August, 1890 20 – 30 ppbv. 40 – 75 ppbv. Crutzen and Zimmermann [1991] Mouillot et al. [2006] van Aardenne et al. [2001] Ito and Penner [2005]
Annual carbon losses due to land-use change in U.S. 0.5 Total Vegetation burned Decay of slash 0.0 Decay of wood products 1900 Houghton et al. [1999]
Surface O3 concentrations (ppbv) in August, 1990 70 ppbv 90 ppbv van Aardenne et al. [2001] Mouillot et al. [2006] Ito and Penner [2005] Observation: 71 ppbv [Kirchhoff and Rasmussen, 1990].
Mode of clearing and fate of cleared carbon Open fires Biofuel burning Lumber
Need to increase range of uncertainty considered in RF to T calculation! (not yet included) Analysing countries’ contribution to climate change (MATCH).
Uncertainties in estimating historical emissions from land use change ○Akinori Ito, Richard Houghton, Omar Masera Cerruti, Navin Ramankutty, Christinano Pires de Campos, Audrey Wang, Olga Krankina, Woldgang Cramer, Theima Krug, Joyce Penner, Michael Prather, Atul Jain, Ruth DeFries, Luiz Pinguell Rosa, Wolfgang Knorr, Silva Muylaert, Michio Kawamiya, Prabir Patra, Tomomichi Kato, George Hurtt, Steve Frolking, and Martina Jung.
Background Global estimates of carbon emissions from land-cover change. Ramankutty et al. [2006] H2003: Houghton [2003]. CCMLP: Carbon Cycle Model Linkage Project (HRBM, IBIS, LPJ, and TEM) [McGuire et al., 2001]. AVHRR: DeFries et al. [2002]. TREES: Achard et al. [2004]. F2000: Fearnside [2000].
Background Land-use emissions of different land cover data sets. Jain and Yang [2005] Ramankutty et al. [2006]
Comparison analysis of land use change emissions Net CO2 emissions in each country 1. Statistical report United Nations Framework Convention on Climate Change (UNFCC) 2. Inverse model 3. Forward model Book-keeping model, Ecosystem model.
Land-use emissions of different land cover data sets Houghton IVIG [de Campos et al] HYDE 2.0, FAO rate of change, ISAM carbon content calibration EDGAR-HYDE1.4 (forest burning based on decadal FAO assessments)
Houghton IVIG [de Campos et al] EDGAR-HYDE1.4 (forest burning) Land-use emissions of different land cover data sets. Ramankutty et al. [2006]
Land-use emissions of different land cover data sets. Houghton IVIG [de Campos et al] EDGAR-HYDE1.4 (forest burning) Jain and Yang [2005]
Comparison analysis of land use change emissions Carbon pools (Plant Functional Types) in each country 1. Vegetation carbon Ground vegetation, Non-woody tree parts, Woody tree parts 2. Litter Decomposable plant material, resistant material 3. Soil Microbial biomass, Humus organic matter, Inert organic matter Land cover (Plant Functional Types) in each country
Comparison analysis of land use change emissions 1. Emissions due to land-use change 1. Conversion flux (burning of plant material) 2. Product pools 1 yr (agriculture products) 10 yr (paper products) 100 yr (Long-lived products) 3. Decay of organic matter 2. Sinks due to land-use change 1. Regrowth of forests 3. Net terrestrial carbon emissions, including effect of climate change and CO2 increase (woody invasion into grasslands, woody thickening) Jain and Yang [2005]
Comparison analysis of land use change emissions Carbon dynamics following deforestation. Agriculture abandonment Permanent agriculture Shifting cultivation Logging Ramankutty et al. [2006] Clearing forests for pastures (no cultivation) Wildfires Woody invasion into grasslands Woody thickening