Wafer Level Reliability
Wafer Level Reliability. System Assembly. PC Board Assembly. End-Use Customer. Component Manufacturing. Raw Material Supplier (i.e. Leadframe). FSC Worldwide Quality & Reliability Built-In Reliability Initiative. Control Points for Emphasis Development Manufacturing.

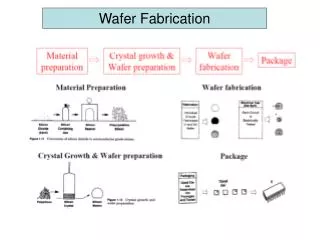
Wafer Level Reliability
E N D
Presentation Transcript
System Assembly PC Board Assembly End-Use Customer Component Manufacturing Raw Material Supplier (i.e. Leadframe) FSC Worldwide Quality & ReliabilityBuilt-In Reliability Initiative Control Points for Emphasis Development Manufacturing
Built-In Reliability Approach Failure Mechanism Driven Reliability Characterization Methodology 1. DEFINE WORST CASE USE ENVIRONMENT 2. DEFINE QUALITY AND RELIABILITY EXPECTATIONS 3. DEFINE POTENTIAL RELIABILITY FAILURE MECHANISMS 4. DEFINE RELEVANT RELIABILITY MODELS • Temp, RH, # On/Off Cycles • Max. ppm allowable, product lifetime, cumulative ppm • Corrosion, electromigration, intermetallic growth • Arrhenius, Eyring, Coffin-Manson 7. PERFORM CONSTRUCTION ANALYSIS 6. DEFINE STRESS LIMITATIONS 8. PERFORM MATERIAL ANALYSIS 5. IDENTIFY ACCELERATING FACTORS • Dry vs. wet Tg, CTE1, CTE2, Young’s Modulus • Demonstrated mfg. construction quality, compliance to design rules • Max. temperature, max. current density • Temperature, voltage, current density, RH 9. PERFORM PKG / PROCESS SIMULATIONS 10. ALR / WLR TEST CHARACTERIZATION 11. FINALIZE POR (Process of Record) • Thermal, electrical, mechanical, • Gate Oxide QBD, Hot E Gm degradation, bond shear, DEA
Coffin Manson Reliability Model * Note: enter data inputs into appropriate grey shaded fields
Agenda • What is Wafer Level Reliability (WLR)? • Advantages over traditional Reliability • Design for Reliability • Develop for Reliability • Manufacture for Reliability
WLR Definition and Advantages • Reliability: The probability that a component will perform a specific function under specific conditions for a specific period of time. • Wafer Level Reliability uses mechanism—specific test structures under accelerated conditions to assess the reliability impacts of process and tool changes • Advantages over Conventional Reliability • Can be done at wafer level—doesn’t need packaging • Accelerated conditions (i.e. voltage, current, temp) speeds-up testing • Specific failure mechanisms can be analyzed individually • Results are process based and can be applied to multiple products • Reduced time to market for new products
Examples of WLR Applications • HC Degradation: • Splits: 3 spacers and 5 LDD dose splits—15 splits; each split needs 2 or 3 weeks HCS in PL; total: 20 weeks or more; new technology ~ 9 months to a year! • Need WLR!!! Compare the degradation rate between PLR and WLR. Each split just needs one hour stress, total 15 hours • Payoff: 15 hours vs. 3000 hours; WLR:200 times FAST
Reliability Objectives • Allow more aggressive performance without increased failure rate • Eliminate reliability concerns prior to qualification • Meet customers demands and expectations • How long should product last (i.e. 2 years to 20 years) • Expected failures in time (i.e.1 FIT =1 failure in 10^9 power on hrs.)
WLR Applications • Infant Mortality: Device failures due to built-in defects. WLR stress can help to determine the root cause. The WLR stress: such as PIC, Dielectric BV, Qbd test • Wearout Failures:The failure rate is increasing. The failures are caused by mechanisms such as electromigration, time dependent dielectric breakdown, and hot carrier degradation.
WLR Correlation • If there is no statistical difference in the performance of subsequent product---subsequent product will have the same reliability as the qualification product. • Otherwise the subsequent lot is anomalous material needing further engineering study. • Build up the correlation between WLR and PLR. • Effects of assembly and packaging • The figure for EM of 12-inch and 8-inch wafers from a supplier.
WLR Objectives • Design for Reliability • Develop tools for and consult with Designers to maximize performance of new products without impacting reliability • Develop for Reliability • Use mechanism-specific test structures under accelerated conditions to eliminate reliability concerns prior to qualification • Manufacture for Reliability • Use the same test structures to make tool and process improvements and act as a line monitor
Design for Reliability Provide the reliability data to designer through the reliability calculator. Hot Carrier, Mobile ion, TDDB, EM Updated on an ongoing basis Assess reliability risk for new designs and update the reliability design rules: Design needs to increase operating voltage in gate oxide, current density in metal, and operating voltage on caps (such as HV poly sink caps). How to screen out the defect for gate oxide extrinsic failure. Consulting available upon request Develop AC hot carrier stress Methodology Confirm Berkeley Model for HC degradation in AC application.
GOI Test Methodology • JRAMP • J-Ramp test searches for the breakdown voltage (Vbd) and then calculates the breakdown charge (Qbd) of thin oxide capacitors. • JRAMP Test Sequence • Makes timing measurements of all procedures used during the ramp • Checks the integrity of the structure to be stressed (leakage current test at use voltage) • Logarithmically ramps current (5 pS ramp rate) • Records current, voltage, and time at each step/interval • Terminates the test when • - Voltage compliance is reached • - Max Qbd is reached • - Next current step (if allowed) exceeds max • current density • - Elapsed time exceeds pre-set max test time • - Percentage decrease in measured voltage • from previously measured voltage exceeds • specified ratio. • Calculates outputs/results
Antenna Test Methodology Linear Voltage Ramp • VRAMP • V-Ramp test searches for the breakdown voltage (Vbd) and then calculates the breakdown charge (Qbd) of thin oxide capacitors. • VRAMP Test Sequence • Makes timing measurements of all procedures used during the ramp • Checks the integrity of the structure to be stressed (leakage current test at use voltage) • Linearly ramps the voltage (5 pS ramp rate) • Records voltage, current, and time at each step/interval • Terminates the test when • - Measured current exceeds breakdown current • - Max Qbd is reached • - Next current step (if allowed) exceeds max • current density • - Elapsed time exceeds pre-set max test time • - Shift in slope of the resultant I/V curve is • excessive or slope goes negative • Calculates outputs/results
Test Methodology • Test Method & Conditions • Poly heater 250C • Bias gate to ±100v Effect of Mobile Ion under an Applied Field Test Sequence 1. Initial threshold voltage is measured. Vt#1 2. Stress #1: NMOS a negative bias is applied. PMOS a positive bias is applied. 3. Vt#2 is measured. 4. Delta Vt between Vt#1 and Vt#2 5. Stress #2: NMOS a positive bias is applied. PMOS a negative bias is applied. 6. Final threshold voltage is measured. Vt#3 7. Delta Vt between Vt#2 and Vt#3.
Manufacture for Reliability • Manufacture for Reliability is the application of WLR for monitoring and process changes. • Process Qualification (PQPs) • FMDRC (identify reliability concerns, possibly new structures or test methods) • Define WLR & PLR (Wear-out) test plans to complete Stage IV (Qualification) • Execute testing, analyze and publish results • Define & execute test plan and publish results at Stage VI (Line Warming) • Process Change Support (Change Review Board) • Define failure mechanism risks and WLR test plan, analyze and publish results • Examples: Gate pre-clean (SP-RCA0) and DUV Qualification Plan • Production Monitor • Minimum one lot per week sampling across key technologies • Monthly presentation of yield compliance for critical parameters by technology and drive W3 improvement plans; initiated 2011 P01 22