Download
1 / 26
260 likes | 366 Vues
Do Taxes and Subsidies Improve Diet and Health? . Biing-Hwan Lin Senior Economist, Food Economics Division, USDA/ERS Presentation at 中正大學經濟系 May 12, 2011. Overweight and Obesity Prevalence in the U.S. 1988-94, 1999-2000, 2007-2008.

E N D
Do Taxes and Subsidies Improve Diet and Health? Biing-Hwan Lin Senior Economist, Food Economics Division, USDA/ERS Presentation at 中正大學經濟系 May 12, 2011
Overweight and Obesity Prevalence in the U.S. 1988-94, 1999-2000, 2007-2008 Source: National Health and Nutrition Examination Survey, CDC
Weight Gains Reflect • Energy imbalance • We take in more calories than we expand
Rising Calorie Intakes: 1977 to 2006 Sources: 1977-78 NFCS, 1989-91 and 1994-98 CSFII, USDA; 2003-6 NHANES, CDC
Trend in Beverage Consumption in the US Sources: 1977-78 NFCS, 1989-91 and 1994-98 CSFII, USDA; 1999-2004 NHANES, CDC.
Sources of Calories In the US Sources: 1977-78 NFCS, 1989-91 and 1994-98 CSFII, USDA; 2003-6 NHANES, CDC
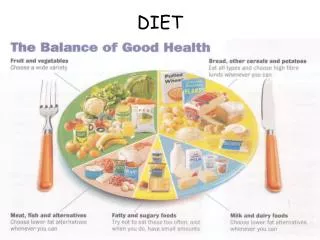
Will Eat More Fruits and Vegetables Help? Fruits and vegetables are rich in water and fiber, low in energy density Eating more fruits and vegetables promote satiety and decrease energy intake Source: 1999-2002 NHANES, CDC
New Release: Food Marketing Institute(October 8, 2010) FMI Grocery Shopper Trends 2010: Consumers are Savvy and Informed Bargain Hunters When it Comes to Grocery Shopping
Pricing policies to improve diet:Two case studies • Taxing Caloric Sweetened Beverages (CSB) • Subsidizing fruits, vegetables, and milk Approach • Estimate food demands to obtain demand elasticities • Apply the elasticities to intake data to examine potential effects of pricing policies
Taxing Caloric Sweetened Beverages: Potential Effects on Consumption, Calorie Intake, and Obesity.ERS report by Smith, Lin, and Lee, 2010 The Effects of a Sugar-Sweetened Beverage Tax: Consumption, Calorie Intake, Obesity, and Tax Burden by Income. AAEA 2010 presentation by Lin, Smith, and Lee Measuring Weight Outcomes for Obesity Intervention Strategies: The Case of a Sugar-Sweetened Beverage Tax. Working paper by Lin, Smith, Lee, and Hall
Beverage Demand • Separation of CSBs and their diet counterparts • CSB (sodas, fruit drinks, sports and energy drinks, and powdered mixes) • Potential CSB substitutes and complements • Diet drinks • Milk (skim, low-fat, and whole) • 100% fruit/vegetable juices • Coffee/teas • Bottled water
Nielsen National Consumer Panel, 1998-2007 (Purchase data for demand estimation) • Household purchases of groceries scanned at home • Quantity, expenditure, and demographics CDC National Health and Nutrition Examination Survey, 2003-6 (Consumption data for intake analysis) • 24-hr dietary recall • Comprehensive physical, including weight and height
Beverage Consumption, 2003-6 Source: ERS calculation of 2003-06 National Health and Nutrition Examination Survey (NHANES), first-day intake data.
(A) Elasticity High income (B) Elasticity X 20% tax (C) Individual daily intake (D) Change in individual daily intake (E) Reduction in calories and weight -1.292 -0.591 0.344 0.227 -0.054 0.529 -0.185 1.005 Percent -25.84 -11.82 6.88 4.54 -1.08 10.58 -3.70 20.10 kcal/day 216 kcal 0 0 122 0 112 2 0 kcal/day -55.8 kcal 0.0 0.0 5.5 0.0 11.4 -0.1 0.0 Beverages Sugary drinks Diet drinks Skim milk Low fat milk Whole milk Juices Coffee/tea Bottled water 38.5 kcal/day -14,053 kcal/yr -4.0 lbs/yr Effect of soda tax on calorie intake and body weight Example: A 5’10” man weighing 175 pounds would have a BMI of 25.1—overweight. He drinks a 12 oz. of cola, 8 oz of fruit drink, 8 oz of 2% milk, 8 oz of orange juice, and 8 oz of unsweetened brewed tea. After the tax, other things being equal, the adult male trims off 4.1 pounds and reduces BMI to 24.5—normal weight.
Static rule of 3500 kcal = 1 poundwidely applied, but over-estimates weight outcome • 3500 calories are based on a fixed body composition—75% fat and 25% lean tissue • Body composition varies by age, gender, race/ethnicity, and body weight • Weight loss is dynamic because energy requirement depends on many factors, including body weight • An initial reduction of energy intake results in weight loss, which in turn reduces the energy requirement and hence weight loss slows down over time.
Subsidize purchase of healthy food:fruits, vegetables, and milk ECONOMIC INCENTIVES FOR DIETARY IMPROVEMENT AMONG FOOD STAMP RECIPIENTS Lin, Yen, Dong, and Smallwood. Contemporary Economic Policy, 2010,28(4): 524-36
1999–2002 food intakes, compared with 2005 Dietary Guidelines
Data Used • USDA National Food Stamp Program Survey 1996-7, which has household food use records (quantity and expenditure) • National Health and Nutrition Examination Survey 1999-2002, which has a 24-h recall of food intake at home and away from home
Price subsidy Assumptions • Price is subsidized by 10% • Subsidy applied to food purchased at grocery stores • Subsidy applied to fruits, vegetables, and fluid milk as is, not mixtures
Quantity Responses to 10% price subsidy (Food stamp Recipients)
Summary • In general, food demand is known to be own-price inelastic for broadly defined food categories • First Fundamental Theorem of Taxation: a tax has little effect on inelastic goods • As we disaggregate food groups, food demands tend to become more own-price elastic because of the influences of substitutes and complements • To simulate the effects of pricing policies on diet and health, it is inappropriate to rely exclusively on the own-price elasticities. Cross-price effects have to be incorporated.