Download
1 / 40
400 likes | 414 Vues
Explore the application of Artificial Neural Networks to model Delta flow-turbidity relationships. Findings indicate ANNs faithfully emulate turbidity fate in the Delta. Steps include evaluating auto-regressive networks and CalSim implementation.

E N D
Modeling Delta Flow-Turbidity Relationshipswith Artificial Neural Networks • CWEMF Annual Meeting • April 16, 2012 • Paul Hutton, Ph.D., P.E.
Acknowledgements Dr. Sujoy Roy, Tetra Tech Dr. Limin Chen, Tetra Tech Sanjaya Seneviratne, DWR
Summary Findings • Additional review is needed before firm conclusions can be reached. • ANNs appear to faithfully emulate DSM2 turbidity fate and transport during the season of interest (i.e. Dec-Feb). • ANNs appear to provide a promising foundation for representing turbidity-based regulations in CalSim.
Modeling Delta Flow-Turbidity Relationshipswith Artificial Neural Networks Background Model Development Results Next Steps
RPA Component 1:Protection of Adult Delta Smelt Life Stage … delta smelt have historically been entrained when first flush conditions occur in late December. In order to prevent or minimize such entrainment, Action 1 shall be initiated on or after December 20 if the 3 day average turbidity at Prisoner’s Point, Holland Cut, and Victoria Canal exceeds 12 NTU… Action 1 shall require the Projects to maintain OMR flows no more negative than -2000 cfs… Source: Remanded USFWS 2008 Biological Opinion
Modeling Delta Flow-Turbidity Relationshipswith Artificial Neural Networks Background Model Development Results Next Steps
ANN Training DataDSM2 Simulations Notes: (1) DCC gates closed; (2) South Delta barriers not installed; (3) Constant Martinez & agricultural return turbidity boundary conditions
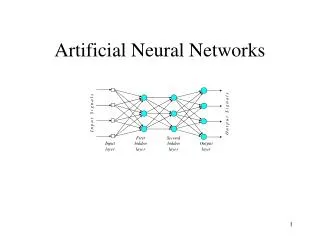
ANN Model StructureMatlab Feed Forward y(t) = f(x(t-1), …., x(t-d)) Inputs = 6 boundaries (3 flow & 3 turbidity) Hidden Neurons = 10 Time delay = 1-2 days Outputs: turbidity at 6 locations
ANN Model StructureBoundary Input (Daily Averages) • Flow • North Delta (Freeport + Yolo) • East Side Streams • Calculated Old & Middle Rivers • Turbidity (Flow-weighted) • North Delta (Freeport + Yolo) • East Side Streams • Vernalis
1 Sacramento River at Rio Vista San Joaquin River at Prisoners’ Point Old River at Quimby Island Middle River at Holt Old River at Bacon Island Clifton Court Forebay Entrance 1 2 3 2 4 ANN Model StructureOutput Locations 3 5 4 6 5 6
ANN Model StructureTraining Process • DSM2 data points are randomly assigned: • Training 60% • Validation 20% • Testing 20% • Training data are used to compute network parameters. Intermediate results are iteratively compared with validation data until residual error is minimized. • Testing data are independent of training and validation data and are used to evaluate network predictive power.
Modeling Delta Flow-Turbidity Relationshipswith Artificial Neural Networks Background Model Development Results Next Steps
Model Results: Summary StatisticsANN Turbidity (ntu) = Ф1 + Ф2 * DSM2 Turbidity (ntu)
Steady State Flow-Turbidity Relationshipas a Function of North Delta TurbidityOld River @ Quimby Island Steady State Assumptions North Delta Flow = 30,000 cfs East Side Flow = 1500 cfs Vernalis Turbidity = 30 ntu East Side Turbidity = 30 ntu
Modeling Delta Flow-Turbidity Relationshipswith Artificial Neural Networks Background Model Development Results Next Steps
Next Steps • Evaluate auto-regressive networks • Explore tidal input variable • Implement methodology in CalSim
Next Steps (cont’d)CalSim Implementation • Decision statement: Reduce pumping as needed to increase OMR flows, thereby controlling turbidity levels as defined by existing or alternative regulations. • Develop 82-year turbidity time series for Delta inflows • Integrate information into monthly time step • Refine ANN training (and associated data) as needed
Paul Hutton, Ph.D., P.E. phutton@mwdh2o.com
Turbidity Boundary Conditions (cont’d) Calaveras Yolo Bypass
Turbidity Boundary Conditions (cont’d) Cosumnes River Mokelumne River
Model Results2009-10 Historical Conditions Old River @ Quimby Island Sacramento River @ Rio Vista
Steady State Flow-Turbidity Relationshipas a Function of North Delta TurbiditySacramento River @ Rio Vista Steady State Assumptions North Delta Flow = 30,000 cfs East Side Flow = 1500 cfs Vernalis Turbidity = 30 ntu East Side Turbidity = 30 ntu
Steady State Flow-Turbidity Relationshipas a Function of North Delta TurbiditySan Joaquin River @ Prisoner’s Point Steady State Assumptions North Delta Flow = 30,000 cfs East Side Flow = 1500 cfs Vernalis Turbidity = 30 ntu East Side Turbidity = 30 ntu
Steady State Flow-Turbidity Relationshipas a Function of North Delta TurbidityMiddle River @ Holt Steady State Assumptions North Delta Flow = 30,000 cfs East Side Flow = 1500 cfs Vernalis Turbidity = 30 ntu East Side Turbidity = 30 ntu
Steady State Flow-Turbidity Relationshipas a Function of North Delta TurbidityOld River @ Bacon Island Steady State Assumptions North Delta Flow = 30,000 cfs East Side Flow = 1500 cfs Vernalis Turbidity = 30 ntu East Side Turbidity = 30 ntu
Steady State Flow-Turbidity Relationshipas a Function of North Delta TurbidityClifton Court Forebay Entrance Steady State Assumptions North Delta Flow = 30,000 cfs East Side Flow = 1500 cfs Vernalis Turbidity = 30 ntu East Side Turbidity = 30 ntu
Steady State Flow-Turbidity Relationshipas a Function of North Delta TurbidityClifton Court Forebay Entrance Steady State Assumptions North Delta Flow = 30,000 cfs East Side Flow = 1500 cfs Vernalis Turbidity = 100 ntu East Side Turbidity = 30 ntu
ANN Model StructureMatlab Autoregressive y(t) = f(x(t-1), …., x(t-d)) Boundary Inputs = 6 (3 flow & 3 turbidity) Recursive Input = 6 (turbidity) Hidden Neurons = 10 Time delay = 1-4 days Outputs: turbidity at 6 locations
Spring-Neap Effect on TurbidityClifton Court Forebay Entrance 1994-95 Study 4 Study 10