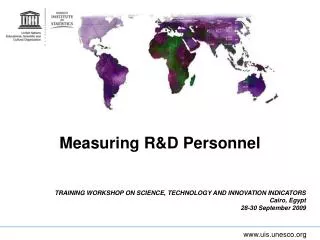
Measuring R&D Personnel
240 likes | 472 Vues
Measuring R&D Personnel. TRAINING WORKSHOP ON SCIENCE, TECHNOLOGY AND INNOVATION INDICATORS Cairo, Egypt 28-30 September 2009. WHAT DO WE MEASURE: Types of indicators. Input indicators: R&D expenditure and human resources. Output indicators: publications and patents.

Measuring R&D Personnel
E N D
Presentation Transcript
Measuring R&D Personnel TRAINING WORKSHOP ON SCIENCE, TECHNOLOGY AND INNOVATION INDICATORSCairo, Egypt28-30 September 2009
WHAT DO WE MEASURE: Types of indicators • Input indicators: R&D expenditure and human resources. • Output indicators: publications and patents. • Impact indicators: innovation, social impact (?). • Technology transfer indicators: technology balance of payment.
R&D: Definition Research and experimental development (R&D) comprise creative work undertaken on a systematic basis in order to increase the stock of knowledge, including knowledge of man, culture and society, and the use of this stock of knowledge to devise new applications.
Industrial + Admin and other sup. activities STA R&D STET Innovation STS The basic criterion for distinguishing R&D from related activities is the presence in R&D of an appreciable element of novelty and the resolution of scientific and/or technological uncertainty, i.e. when the solution to a problem is not readily apparent to someone familiar with the basic stock of common knowledge and techniques for the area concerned.
Frascati Manual deals with “Input indicators” • R&D Personnel: are all persons employed directly on R&D, as well as those providing direct services such as R&D managers, administrators, and clerical staff. • Researchers • Technicians • Other supporting staff • R&D Expenditure Both inputs are necessary to secure an adequate representation of the effort devoted to R&D
Researchers Researchersare professionals engaged in the conception or creation of new knowledge, products, processes, methods and systems and also in the management of the projects concerned
Researchers (continued) • Researchers are classified in ISCO-88 Major Group 2, “Professionals”, and in “Research and Development Department Managers” (ISCO-88, 1237). By convention, members of the armed forces with similar skills who perform R&D should also be included. • Managers and administrators engaged in the planning and management of the scientific and technical aspects of a researcher’s work also fall into this category. Their rank is usually equal or superior to that of persons directly employed as researchers and they are often former or part-time researchers. • Postgraduate students at the PhD level engaged in R&D should be considered as researchers. They typically hold basic university degrees (ISCED level 5A) and perform research while working towards the PhD (ISCED level 6). All postgraduate students working on R&D and receiving funding for this purpose (in the form of a salary from the university or a scholarship or another sort of funding) should in principle be included in R&D personnel headcounts. However, it may be necessary, for practical reasons, to reduce coverage to those students for whom the corresponding R&D expenditures and full-time equivalence can be estimated.
Technicians and equivalent staff Technicians and equivalent staff are persons whose main tasks require technical knowledge and experience in one or more fields of engineering, physical and life sciences or social sciences and humanities. They participate in R&D by performing scientific and technical tasks involving the application of concepts and operational methods, normally under the supervision of researchers. Equivalent staff perform the corresponding R&D tasks under the supervision of researchers in the social sciences and humanities.
Technicians and equivalent staff(contd.) • Technicians and equivalent staff are classified in ISCO-88 Major Group 3, “Technicians and Associate Professionals”, notably in Sub-major Groups 31, “Physical and Engineering Science Associate Professionals”, and 32, “Life Science and Health Associate Professionals”, and in ISCO-88, 3434, “Statistical, Mathematical and Related Associate Professionals”. Members of the armed forces who work on similar tasks should also be included. • Their tasks include: • Carrying out bibliographic searches and selecting relevant material from archives and libraries. • Preparing computer programmes. • Carrying out experiments, tests and analyses. • Preparing materials and equipment for experiments, tests and analyses. • Recording measurements, making calculations and preparing charts and graphs. • Carrying out statistical surveys and interviews.
Other supporting staff Other supporting staffincludes skilled and unskilled craftsmen, secretarial and clerical staff participating in R&D projects or directly associated with such projects.
Other supporting staff (continued) • Other R&D supporting staff are essentially found in ISCO-88 Major Groups 4, “Clerks”; 6, ”Skilled Agricultural and Fishery Workers”; and 8, ”Plant and Machine Operators and Assemblers”. • Included under this heading are all managers and administrators dealing mainly with financial and personnel matters and general administration, insofar as their activities are a direct service to R&D. They are mainly found in ISCO-88 Major Group 2, “Professionals”, and Minor Group 343, “Administrative Associate Professionals” (except 3434).
Head Count data “Head Count (HC)” dataare data on the total number of persons who are mainly or partially employed on R&D. Headcount data are the most appropriate measure for collecting additional information about R&D personnel, such as age, gender or national origin.
Head Count data • Possible approaches and options • Number of persons engaged in R&D at a given date (e.g. end of period). • Average number of persons engaged in R&D during the (calendar) year. • Total number of persons engaged in R&D during the (calendar) year.
Full time equivalent - FTE • Series based on the number of full-time equivalent staff are considered to be a true measure of the volume of R&D. • R&D may be the primary function of some persons (e.g. workers in an R&D laboratory) or it may be a secondary function (e.g. members of a design and testing establishment). It may also be a significant part-time activity (e.g. university teachers or postgraduate students). To count only persons whose primary function is R&D would result in an underestimate of the effort devoted to R&D; to do a headcount of everyone spending some time on R&D would lead to an overestimate. The number of persons engaged in R&D must, therefore, also be expressed in full-time equivalents on R&D activities.
FTE • One FTE may be thought of as one person-year. Thus, a person who normally spends 30% of his/her time on R&D and the rest on other activities (such as teaching, university administration and student counselling) should be considered as 0.3 FTE. Similarly, if a full-time R&D worker is employed at an R&D unit for only six months, this results in an FTE of 0.5. • Another option is to calculate FTEs based on the average hours worked per week, or devoted to each activity per week.
4 HC 1 HC 1 HC 1 HC 1 HC FT: > 90% PT: 60% PT: 40% SPT: 20% SSPT: < 5 - 0% 1 FTE 0.6 FTE 0.2 FTE 0.4 FTE 2.2 FTE
FTE on a fixed date: survey the FTE of R&D personnel as of a specific date is possible. If, however, there are significant seasonal variations in R&D employment (e.g. temporary staff hired by governments at the end of the university teaching year), allowance should be made for these variations in order to allow for comparison with data based on FTE during a period. FTE during a period is more appropriate. • Diversity of methods and the need for disclosure of method used: A number of restrictions apply to the actual measurement of FTE. It is therefore impossible to avoid differences in the methodology used for different countries and sectors. To improve international comparability regardless of the measurement methods used, the details of the methods employed should be made public.
Specific problems in the higher education sector: Definition of working time: The one aspect of an academic teacher’s/researcher’s workload that is usually well-defined is the number of his/her teaching hours in the academic year. Absolute working time varies according to a number of factors, such as: Number of teaching hours per week; Demands made by examinations and student supervision on teachers’ time; Administrative duties, which vary according to the time of year; Nature of R&D activities and deadlines imposed for publication and/or presentation of results; Student vacation periods. The working pattern of the staff therefore is very flexible. It has been found that much of their professional activity – notably R&D – is carried out outside “normal working hours”. Calculation of full-time equivalence: Calculation of full-time equivalent R&D personnel must be based on total working time. Accordingly, no one person can represent more than one FTE in any year and hence cannot perform more than one FTE on R&D.
FTE: sources • Time-use surveys: (5-6 years) - those based on researchers’ own evaluation of the distribution of their working time: surveys on the distribution of working time during the whole year: Respondents are asked to estimate the allocation of their working time over a whole year according to various categories of work-related activities. Two categories “research” and “other” OR many categories are possible: – Undergraduate teaching time: … % – Postgraduate course-work time: … % – Postgraduate research time: … % – Personal research time: … % – Administration: … % – Examinations: … % – Student counseling: … % – Un allocable internal time: … % – External professional time: … % – Total time: 100%
- those based on estimates by the heads of university departments or institutes: on total resources available and on the estimated share of R&D in these resources. Survey: Full-time / part-time / 50% of time / 30% of time …. The method is cheaper than those described above and puts a less heavy burden on respondents. In this case, the questionnaires are usually addressed to the head of the institute, who is assumed to have the knowledge of ongoing activities needed to supply sufficiently accurate estimates.
R&D coefficients • Non-survey-based R&D coefficients are derived in a number of ways, ranging from informed guesses to sophisticated models. • They may be derived in several ways, depending on the information available to the responsible statistical unit. Sources of information: Employment contracts may specify time allowed for some activities; the job descriptions of some categories of employee may provide useful input; Some institutions may have established full or partial coefficients for their own planning or evaluations; other countries with similar education systems may have derived relevant coefficients; Research grants given to different institutions; S&T publications, etc. • The accuracy of the coefficients depends on the quality of the judgement used in calculating them; It is essential that experienced and knowledgeable persons participate in the work. • When choosing the most appropriate survey method, the following factors have to be considered: the resources available to the producers of statistics; the desired level of quality of the statistics; the burden that can reasonably be laid on university administrations and individual respondents; special features of the country.
FTE & GERD • Calculating full-time equivalents (FTE) is key to adequately calculating the Gross Expenditure in R&D (GERD). Since researcher’s salaries are a significant part of GERD, it is important to include in the GERD only the proportion of the salaries devoted to R&D, this is, the FTE R&D salaries. If the HC salaries are included, GERD will be significantly overestimated.
Tables recommended by Frascati Manual • Total national R&D personnel by sector and by occupation (HC & FTE) • Total national R&D personnel by sector and by level of qualification (HC & FTE) • Researchers and, if possible, other categories of R&D personnel (HC), by: • Sex • Age
Thank you! http://www.uis.unesco.org r.pathirage@uis.unesco.org