Download
1 / 36
360 likes | 375 Vues
Introduction to Plant Biotechnology PlSc 452/552 Lecture 1 Chapter 1. C. Neal Stewart, Jr. plantsciences.utk.edu/stewart.htm nealstewart@utk.edu. Rules for class. Do the readings Proper preparation prevents poor performance Ask lots of questions Question the answers

E N D
Introduction to Plant BiotechnologyPlSc 452/552 Lecture 1 Chapter 1 C. Neal Stewart, Jr. plantsciences.utk.edu/stewart.htm nealstewart@utk.edu
Rules for class • Do the readings • Proper preparation prevents poor performance • Ask lots of questions • Question the answers • All opinions will be heard and respected • This class is mostly about the science of plant biotechnology and so facts are valued • Grades are not awarded on the basis of need Have fun!
Questions for the semester • What is/are genetic engineering, transgenic plants, biotechnology? • What are the current and potential applications? • Risks? • Benefits? • How does plant biotechnology fit in with modern agriculture and its current and future challenges?
Today’s objectives and questions • Define plant biotechnology. • What biotech crops are grown and where? • Why do farmers grow transgenic crops? • How has the adoption of plant biotechnology impacted the environment? • What has been plant biotech’s impact in the US and in developing countries? • What is the prospect for future impact?
Central dogma: DNARNA protein: why genetic engineering is possible
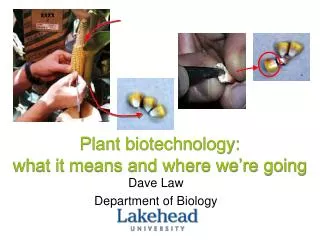
Transgenic plants-Agrobacterium Any gene, any organism The new plant will pass the transgene to its progeny through seed.
Biolistics Consumer reports, Sept. 1999
Plant biotech milestones • 1962 Murashige and Skoog publish their paper on tissue culture media that is very effective for tobacco and other plants • 1982 First stably transgenic plant—marker gene in tobacco • 1987 Gene gun invented • 1994 Flavr Savr tomato commercialized • 1996 First wide-scale planting of soybean and corn • 2005 Billionth acre of transgenic crop planted somewhere in the world • 2008 Second billionth acre planted • 2011 Third billionth acre planted • 2013 Fourth billionth acre planted
Figure 1.2 Figure 1.2 Global Area of Biotech Crops, 1996–2012: by Crop (Million Hectares). (Source: James, Clive. 2012. Global Status of Commercialized Biotech/GM crops: 2012. ISAAA Brief No. 44. ISAAA: Ithaca, NY.)
Progression of transgenic plants • 1st Generation: Input traits (herbicide tolerance, insect resistance, etc.) • 2nd Generation: Output traits: (pharmaceuticals, enhanced nutrition, etc.) • 3rd Generation: Non-ag– (phytoremediation, sentinels, detectors)
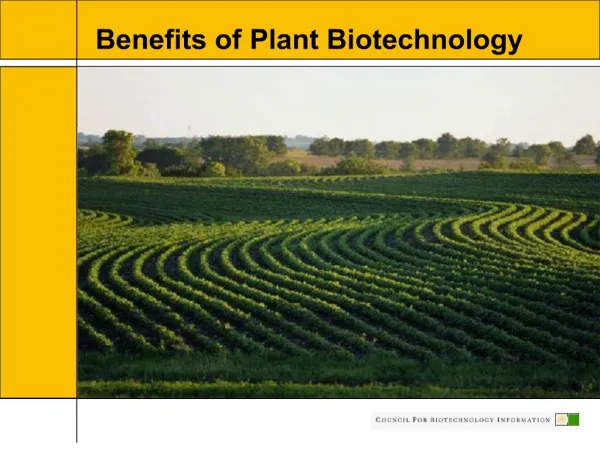
Environmental benefitsHerbicide tolerant crops have increased and encouraged no-till agriculture– less soil erosion.Over 1 million gallons of unsprayed insecticide per year.
Dr. Norman BorlaugNobel Peace Prize 1970Father of the Green Revolution1914-2009
TABLE 1.1 Global farm income benefits from growing GM Crops 1996–2012 (million US $). Notes: All values are nominal. Others = Virus resistant papaya and squash and herbicide tolerant sugar beet. Totals for the value shares exclude ‘other crops’ (i.e., relate to the 4 main crops of soybeans, maize, canola and cotton). Farm income calculations are net farm income changes after inclusion of impacts on yield, crop quality and key variable costs of production (e.g., payment of seed premia, impact on crop protection expenditure)
TABLE 1.2 GM crop farm income benefits during 1996–2012 in selected countries (million US $).
TABLE 1.3 GM crop farm income benefits, 2012: developing versus developed countries (million US $). Developing countries = all countries in South America, Mexico, Honduras, Burkina Faso, India, China, the Philippines and South Africa
TABLE 1.4. Cost of accessing GM technologya relative to total farm income benefits (USD $, millions) 2012. N/a = not applicable. Cost of accessing technology based on the seed premiums paid by farmers for using GM technology relative to its conventional equivalents
TABLE 1.5 Additional crop production arising from positive yield effects of GM crops. Note: GM HT sugar beet has been commercialized only in the US and Canada since 2008
Environmental Impact Quotient (EIQ) • Assessment of pesticide active ingredient used • Assessment of the specific pesticides used • Provides environmental impacts of individual pesticides into a single ‘field value per hectare’. • Balanced assessment of the impact of GM crops on the environment • Includes key toxicity and environmental exposure data • related to individual products • applicable to impacts on farm workers • consumers and ecology • consistent and comprehensive measure of environmental impact. (Kovach et al. (1992)
EIQ example The EIQ value is multiplied by the amount of pesticide active ingredient (ai) used per hectare to produce a field EIQ value. For example, the EIQ rating for glyphosate is 15.3. By using this rating multiplied by the amount of glyphosate used per hectare (eg, a hypothetical example of 1.1 kg applied per ha), the field EIQ value for glyphosate would be equivalent to 16.83/ha. In comparison, the field EIQ/ha value for a commonly used herbicide on corn crops (atrazine) is 22.9/ha.
TABLE 1.6 Impact of changes in use of herbicides and insecticides from growing GM crops globally, 1996–2012.
TABLE 1.7 GM crop environmental benefits from decreased insecticide and herbicide use in 2012: developing versus developed countries.
TABLE 1.8 Impact of GM Crops on Carbon Sequestration Impact in 2012; Car Equivalents Notes: Assumption: an average family car produces 150 grams of carbon dioxide per km. A car travels 15,000 km/year on average and therefore produces 2,250 kg of carbon dioxide/year
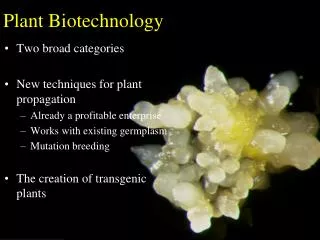
Recap and answers • Plant biotechnology: molecular manipulation of cells and tissues that comprise plants. • What biotech crops are grown and where? Row crops soybean and corn for herbicide tolerance and insect resistance. US but also in 27 other countries. • Why do farmers grow transgenic crops? More efficient and effective; better control of pests. • How has the adoption of plant biotechnology impacted the environment? Positive—less insecticides, less soil erosion. • What has been plant biotech’s impact in the US and in developing countries? Changed row crop genetics in US and is improving yields in international agriculture.
But…GM crops not universally accepted and grown. Why? • Misunderstandings • Politics • Immature regulatory structures • Consumer issues • Benefits unclear to consumers • Fear of unknown, risk perception Science and education should help
“Ordinary Tomatoes Do Not Contain Genes, while Genetically Modified Ones Do” 1996 - 1998 Source: Tom Hoban
“I eat organic food and drink only green tea– gallons of it when I’m writing. I smoke cigarettes, but organic ones”* Discussing her “healthy” lifestyle in Organic Style magazine March 2005.