Download
1 / 2
20 likes | 171 Vues
Scott/Carver County Crash Data Overview. 5 Year Crashes Scott/Carver 10,599 258. Example All – % Severe – %. CSAH/CR 3,631 – 34% 141 – 55%. State System 4,917 – 46% 79 – 31%. City, Twnshp , Other 2,051 – 19 % 38 – 15%. Source: MnCMAT Crash Data, 2007-2011

E N D
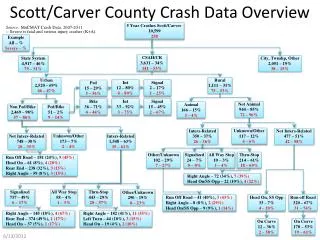
Scott/CarverCounty Crash Data Overview 5 Year Crashes Scott/Carver 10,599 258 Example All – % Severe – % CSAH/CR 3,631 – 34% 141 – 55% State System 4,917 – 46% 79 – 31% City, Twnshp, Other 2,051 – 19% 38 – 15% Source: MnCMAT Crash Data, 2007-2011 -- Severe is fatal and serious injury crashes (K+A). Urban 2,520 – 69% 66 – 47% Rural 1,111 – 31% 75 – 53% Int 12 – 80% 4 – 80% Signal 2 – 17% 1– 25% Ped 15 – 29% 5 – 56% Bike 36 – 71% 4 – 44% Int 33 – 92% 3 – 75% Signal 15 – 45% 2 – 67% Not Animal 944 – 85% 72 – 96% Animal 166 – 15% 3 – 4% Non Ped/Bike 2,469 – 98% 57 – 86% Ped/Bike 51 – 2% 9 – 14% Unknown/Other 117 – 12% 4 – 6% Inters-Related 350 – 37% 26 – 36% Not Inters-Related 477 – 51% 42 – 58% Unknown/Other 173 – 7% 2 – 4% Not Inters-Related 748 – 30% 20 – 35% Inters-Related 1,548 – 63% 35 – 61% Other/Unknown 102 – 29% 7 – 27% Signalized 24 – 7% 0 – 0% All Way Stop 10 – 3% 1 – 4% Thru-Stop 214 – 61% 18 – 69% Run Off Road – 181 (24%), 9 (45%) • Head On – 61 (8%), 4 (20%) Rear End – 238 (32%), 3 (15%) Right Angle – 59 (8%), 3 (15%) Right Angle – 72 (34%), 7 (39%) Head On/SS Opp– 22 (10%), 4 (22%) Signalized 757 – 49% 6 – 17% All Way Stop 58 – 4% 1 – 3% Thru-Stop 443 – 29% 20 – 57% Other/Unknown 290 – 19% 8 – 23% Run Off Road – 41 (40%), 3 (43%) • Right Angle – 8 (8%), 2 (29%) Head On/SS Opp – 9 (9%), 1 (14%) Head On, SS Opp 33 – 7% 4 – 10% Run off Road 320 – 67% 31 – 74% Right Angle – 140 (18%), 4 (67%) Rear End – 374 (49%), 1 (17%) Head On – 37 (5%), 1 (17%) Right Angle – 182 (41%), 11 (55%) Left Turn – 44 (10%), 3 (15%) Head On – 19 (4%), 2 (10%) On Curve 12 – 36% 2 – 50% On Curve 170 – 53% 19 – 61%
Code Guide • Animal, ACCTYPE=08,09 • Rear End, DIAG=01 • Left Turn, DIAG=03 • Right Angle, DIAG=05 • Run off Road, DIAG=04, 07 (Road departure) • Head On, SS Opp, DIAG=08, 09 (Lane departure) • Curve-Related, ROAD CHAR=05-08 • State, SYS=01, 02, 03 • CSAH/CR, SYS=04, 07 • City, Twnshp, Other, SYS=NOT 01-03, 04 or 07 • Urban, City coded • Rural, City not coded (0000) • Intersection-Related, JUNC=2-7, 20-22 • Not Intersection-Related, JUNC=1, 8-11 • Other/Unknown, JUNC=90, 98, 99, 00 • Signalized, TCD=01 • All-Way Stop, TCD=02, 03 • Thru-Stop/Yield, TCD=04, 05 • Other/Unknown, TCD=>06 and 00