Alabama
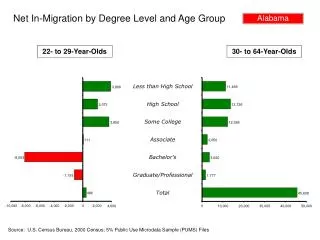
Alabama. 11,469. 3,896. 13,726. 2,073. 3,652. 12,386. 111. 2,650. -8,053. 3,620. -1,193. 1,777. 486. 45,628. -10,000. -8,000. -6,000. -4,000. -2,000. 0. 2,000. 4,000. 0. 10,000. 20,000. 30,000. 40,000. 50,000. Net In-Migration by Degree Level and Age Group.


Alabama
E N D
Presentation Transcript
Alabama 11,469 3,896 13,726 2,073 3,652 12,386 111 2,650 -8,053 3,620 -1,193 1,777 486 45,628 -10,000 -8,000 -6,000 -4,000 -2,000 0 2,000 4,000 0 10,000 20,000 30,000 40,000 50,000 Net In-Migration by Degree Level and Age Group 22- to 29-Year-Olds 30- to 64-Year-Olds Less than High School High School Some College Associate Bachelor’s Graduate/Professional Total Source: U.S. Census Bureau, 2000 Census; 5% Public Use Microdata Sample (PUMS) Files
Alaska 458 160 -3,542 664 -5,670 -387 -1,862 -99 -3,438 1,909 290 428 -14,062 2,973 -15,000 -10,000 -5,000 0 5,000 -500 0 500 1,000 1,500 2,000 2,500 3,000 Net In-Migration by Degree Level and Age Group 22- to 29-Year-Olds 30- to 64-Year-Olds Less than High School High School Some College Associate Bachelor’s Graduate/Professional Total Source: U.S. Census Bureau, 2000 Census; 5% Public Use Microdata Sample (PUMS) Files
Arizona 26,577 44,986 18,358 49,275 22,807 48,431 5,414 17,547 19,564 40,341 4,906 23,911 97,626 224,491 0 20,000 40,000 60,000 80,000 100,000 0 50,000 100,000 150,000 200,000 250,000 Net In-Migration by Degree Level and Age Group 22- to 29-Year-Olds 30- to 64-Year-Olds Less than High School High School Some College Associate Bachelor’s Graduate/Professional Total Source: U.S. Census Bureau, 2000 Census; 5% Public Use Microdata Sample (PUMS) Files
Arkansas 12,044 4,645 10,258 1,536 12,314 202 2,279 184 4,095 -3,373 -481 4,005 2,713 44,995 -4,000 -2,000 0 2,000 4,000 6,000 0 10,000 20,000 30,000 40,000 50,000 Net In-Migration by Degree Level and Age Group 22- to 29-Year-Olds 30- to 64-Year-Olds Less than High School High School Some College Associate Bachelor’s Graduate/Professional Total Source: U.S. Census Bureau, 2000 Census; 5% Public Use Microdata Sample (PUMS) Files
California 89,472 51,179 22,978 -21,006 20,438 -49,567 -5,720 8,388 83,084 140,588 90,482 50,482 148,452 332,346 -50,000 0 50,000 100,000 150,000 0 100,000 200,000 300,000 400,000 Net In-Migration by Degree Level and Age Group 22- to 29-Year-Olds 30- to 64-Year-Olds Less than High School High School Some College Associate Bachelor’s Graduate/Professional Total Source: U.S. Census Bureau, 2000 Census; 5% Public Use Microdata Sample (PUMS) Files
Colorado 18,620 22,985 12,808 12,375 16,744 16,438 4,000 8,093 28,904 34,590 6,403 19,074 87,479 113,555 0 20,000 40,000 60,000 80,000 100,000 0 20,000 40,000 60,000 80,000 100,000 120,000 Net In-Migration by Degree Level and Age Group 22- to 29-Year-Olds 30- to 64-Year-Olds Less than High School High School Some College Associate Bachelor’s Graduate/Professional Total Source: U.S. Census Bureau, 2000 Census; 5% Public Use Microdata Sample (PUMS) Files
Connecticut 7,629 8,927 4,670 3,346 444 -2,612 664 165 -2,683 6,049 3,328 7,027 14,052 22,902 -5,000 0 5,000 10,000 15,000 -10,000 -5,000 0 5,000 10,000 15,000 20,000 25,000 Net In-Migration by Degree Level and Age Group 22- to 29-Year-Olds 30- to 64-Year-Olds Less than High School High School Some College Associate Bachelor’s Graduate/Professional Total Source: U.S. Census Bureau, 2000 Census; 5% Public Use Microdata Sample (PUMS) Files
Delaware 1,609 4,115 1,493 5,277 1,229 4,355 610 1,511 580 764 380 1,678 5,901 17,700 0 1,000 2,000 3,000 4,000 5,000 6,000 0 5,000 10,000 15,000 20,000 Net In-Migration by Degree Level and Age Group 22- to 29-Year-Olds 30- to 64-Year-Olds Less than High School High School Some College Associate Bachelor’s Graduate/Professional Total Source: U.S. Census Bureau, 2000 Census; 5% Public Use Microdata Sample (PUMS) Files
Florida 39,597 110,345 44,891 154,283 39,772 127,815 13,168 49,122 29,140 108,181 10,920 77,664 177,488 627,410 0 50,000 100,000 150,000 200,000 0 175,000 350,000 525,000 700,000 Net In-Migration by Degree Level and Age Group 22- to 29-Year-Olds 30- to 64-Year-Olds Less than High School High School Some College Associate Bachelor’s Graduate/Professional Total Source: U.S. Census Bureau, 2000 Census; 5% Public Use Microdata Sample (PUMS) Files
Georgia 40,947 48,212 29,867 46,866 32,889 45,873 8,664 18,440 40,983 45,234 8,438 25,833 161,788 230,458 0 50,000 100,000 150,000 200,000 0 50,000 100,000 150,000 200,000 250,000 Net In-Migration by Degree Level and Age Group 22- to 29-Year-Olds 30- to 64-Year-Olds Less than High School High School Some College Associate Bachelor’s Graduate/Professional Total Source: U.S. Census Bureau, 2000 Census; 5% Public Use Microdata Sample (PUMS) Files
Hawaii 806 607 1,151 -5,778 -2,132 -11,761 -819 -1,787 2,108 -1,962 1,187 603 2,301 -20,078 -3,000 -2,000 -1,000 0 1,000 2,000 3,000 -25,000 -20,000 -15,000 -10,000 -5,000 0 5,000 Net In-Migration by Degree Level and Age Group 22- to 29-Year-Olds 30- to 64-Year-Olds Less than High School High School Some College Associate Bachelor’s Graduate/Professional Total Source: U.S. Census Bureau, 2000 Census; 5% Public Use Microdata Sample (PUMS) Files
Idaho 2,183 3,458 2,197 6,579 3,475 8,729 -1,366 1,685 -719 5,642 221 3,704 5,991 29,797 -2,000 0 2,000 4,000 6,000 8,000 0 10,000 20,000 30,000 Net In-Migration by Degree Level and Age Group 22- to 29-Year-Olds 30- to 64-Year-Olds Less than High School High School Some College Associate Bachelor’s Graduate/Professional Total Source: U.S. Census Bureau, 2000 Census; 5% Public Use Microdata Sample (PUMS) Files
Illinois 28,386 23,301 10,150 -12,319 -923 -26,273 719 -6,718 29,827 -12,172 14,010 -5,842 82,169 -40,023 -20,000 0 20,000 40,000 60,000 80,000 100,000 -60,000 -40,000 -20,000 0 20,000 40,000 Net In-Migration by Degree Level and Age Group 22- to 29-Year-Olds 30- to 64-Year-Olds Less than High School High School Some College Associate Bachelor’s Graduate/Professional Total Source: U.S. Census Bureau, 2000 Census; 5% Public Use Microdata Sample (PUMS) Files
Indiana 10,034 11,707 9,991 8,753 6,800 5,782 2,497 3,134 -17,339 -2,188 -304 -486 11,679 26,702 -20,000 -15,000 -10,000 -5,000 0 5,000 10,000 15,000 -5,000 0 5,000 10,000 15,000 20,000 25,000 30,000 Net In-Migration by Degree Level and Age Group 22- to 29-Year-Olds 30- to 64-Year-Olds Less than High School High School Some College Associate Bachelor’s Graduate/Professional Total Source: U.S. Census Bureau, 2000 Census; 5% Public Use Microdata Sample (PUMS) Files
Iowa 5,354 5,020 1,718 1,539 733 -542 -552 -2,041 -4,156 -14,579 -3,833 -2,323 -736 -12,926 -20,000 -15,000 -10,000 -5,000 0 5,000 10,000 -6,000 -4,000 -2,000 0 2,000 4,000 6,000 Net In-Migration by Degree Level and Age Group 22- to 29-Year-Olds 30- to 64-Year-Olds Less than High School High School Some College Associate Bachelor’s Graduate/Professional Total Source: U.S. Census Bureau, 2000 Census; 5% Public Use Microdata Sample (PUMS) Files
Kansas 6,758 9,392 4,537 2,061 -295 959 -617 241 -3,431 -517 532 964 7,484 13,100 -4,000 -2,000 0 2,000 4,000 6,000 8,000 -2,000 0 2,000 4,000 6,000 8,000 10,000 12,000 14,000 Net In-Migration by Degree Level and Age Group 22- to 29-Year-Olds 30- to 64-Year-Olds Less than High School High School Some College Associate Bachelor’s Graduate/Professional Total Source: U.S. Census Bureau, 2000 Census; 5% Public Use Microdata Sample (PUMS) Files
Kentucky 6,264 10,866 4,978 13,760 1,347 6,364 870 824 -1,398 3,489 737 798 12,798 36,101 -2,000 0 2,000 4,000 6,000 8,000 10,000 12,000 14,000 0 10,000 20,000 30,000 40,000 Net In-Migration by Degree Level and Age Group 22- to 29-Year-Olds 30- to 64-Year-Olds Less than High School High School Some College Associate Bachelor’s Graduate/Professional Total Source: U.S. Census Bureau, 2000 Census; 5% Public Use Microdata Sample (PUMS) Files
Louisiana 2,141 3,601 -455 -2,656 -748 -3,718 -1,186 -1,211 -5,318 -8,836 -3,102 -6,175 -8,668 -18,995 -10,000 -8,000 -6,000 -4,000 -2,000 0 2,000 4,000 -20,000 -15,000 -10,000 -5,000 0 5,000 Net In-Migration by Degree Level and Age Group 22- to 29-Year-Olds 30- to 64-Year-Olds Less than High School High School Some College Associate Bachelor’s Graduate/Professional Total Source: U.S. Census Bureau, 2000 Census; 5% Public Use Microdata Sample (PUMS) Files
Maine 599 1,262 -503 2,706 -1,163 377 -246 540 -4,772 4,337 -194 5,854 -6,279 15,076 -8,000 -6,000 -4,000 -2,000 0 2,000 0 4,000 8,000 12,000 16,000 Net In-Migration by Degree Level and Age Group 22- to 29-Year-Olds 30- to 64-Year-Olds Less than High School High School Some College Associate Bachelor’s Graduate/Professional Total Source: U.S. Census Bureau, 2000 Census; 5% Public Use Microdata Sample (PUMS) Files
Maryland 7,350 10,173 6,475 5,041 10,740 534 3,255 2,503 15,969 11,386 9,906 20,118 53,695 49,755 0 20,000 40,000 60,000 0 20,000 40,000 60,000 Net In-Migration by Degree Level and Age Group 22- to 29-Year-Olds 30- to 64-Year-Olds Less than High School High School Some College Associate Bachelor’s Graduate/Professional Total Source: U.S. Census Bureau, 2000 Census; 5% Public Use Microdata Sample (PUMS) Files
Massachusetts 8,159 15,707 5,680 664 11,474 -3,864 2,123 -426 21,973 8,550 8,390 10,790 57,799 31,421 0 10,000 20,000 30,000 40,000 50,000 60,000 -5,000 0 5,000 15,000 25,000 35,000 Net In-Migration by Degree Level and Age Group 22- to 29-Year-Olds 30- to 64-Year-Olds Less than High School High School Some College Associate Bachelor’s Graduate/Professional Total Source: U.S. Census Bureau, 2000 Census; 5% Public Use Microdata Sample (PUMS) Files
Michigan 15,529 5,721 2,442 232 2,986 1,046 1,735 -11,665 15,101 1,902 5,487 7,880 43,280 -12,000 -8,000 -4,000 0 4,000 8,000 0 10,000 20,000 30,000 40,000 50,000 Net In-Migration by Degree Level and Age Group 22- to 29-Year-Olds 30- to 64-Year-Olds Less than High School High School Some College Associate Bachelor’s Graduate/Professional Total Source: U.S. Census Bureau, 2000 Census; 5% Public Use Microdata Sample (PUMS) Files
Minnesota 9,688 10,716 6,635 7,406 -481 3,551 2,791 2,863 11,296 7,276 2,370 8,376 32,299 40,188 -5,000 0 5,000 15,000 25,000 35,000 0 10,000 20,000 30,000 40,000 50,000 Net In-Migration by Degree Level and Age Group 22- to 29-Year-Olds 30- to 64-Year-Olds Less than High School High School Some College Associate Bachelor’s Graduate/Professional Total Source: U.S. Census Bureau, 2000 Census; 5% Public Use Microdata Sample (PUMS) Files
Mississippi 2,264 1,837 -1,555 -706 -5,370 -1,300 -4,830 -6,000 -4,000 -2,000 0 2,000 4,000 Net In-Migration by Degree Level and Age Group 22- to 29-Year-Olds 30- to 64-Year-Olds Less than High School High School Some College Associate Bachelor’s Graduate/Professional Total 7,628 11,089 9,246 1,516 1,363 261 31,103 0 5,000 10,000 15,000 20,000 25,000 30,000 35,000 Source: U.S. Census Bureau, 2000 Census; 5% Public Use Microdata Sample (PUMS) Files
Missouri 5,199 10,892 7,285 19,089 7,760 13,290 2,450 5,025 -180 3,222 -123 -1,734 22,391 49,784 -5,000 0 5,000 10,000 15,000 20,000 25,000 -10,000 0 10,000 20,000 30,000 40,000 50,000 Net In-Migration by Degree Level and Age Group 22- to 29-Year-Olds 30- to 64-Year-Olds Less than High School High School Some College Associate Bachelor’s Graduate/Professional Total Source: U.S. Census Bureau, 2000 Census; 5% Public Use Microdata Sample (PUMS) Files
Montana 383 790 -475 3,794 -738 1,073 -240 106 -4,886 360 -644 1,211 -6,600 7,334 -8,000 -6,000 -4,000 -2,000 0 2,000 0 2,000 4,000 6,000 8,000 Net In-Migration by Degree Level and Age Group 22- to 29-Year-Olds 30- to 64-Year-Olds Less than High School High School Some College Associate Bachelor’s Graduate/Professional Total Source: U.S. Census Bureau, 2000 Census; 5% Public Use Microdata Sample (PUMS) Files
Nebraska 4,243 4,745 2,191 185 478 -985 -653 184 -3,169 -348 -1,278 -2,716 1,812 1,065 -4,000 -2,000 0 2,000 4,000 6,000 -4,000 -2,000 0 2,000 4,000 6,000 Net In-Migration by Degree Level and Age Group 22- to 29-Year-Olds 30- to 64-Year-Olds Less than High School High School Some College Associate Bachelor’s Graduate/Professional Total Source: U.S. Census Bureau, 2000 Census; 5% Public Use Microdata Sample (PUMS) Files
Nevada 18,384 34,293 14,086 40,222 14,224 35,643 4,282 11,330 8,179 21,742 1,573 11,504 60,728 154,734 0 15,000 30,000 45,000 60,000 75,000 0 40,000 80,000 120,000 160,000 Net In-Migration by Degree Level and Age Group 22- to 29-Year-Olds 30- to 64-Year-Olds Less than High School High School Some College Associate Bachelor’s Graduate/Professional Total Source: U.S. Census Bureau, 2000 Census; 5% Public Use Microdata Sample (PUMS) Files
New Hampshire 712 1,780 2,576 5,226 1,446 5,169 373 3,144 -2,924 5,994 -72 4,220 2,111 25,533 -3,000 -2,000 -1,000 0 1,000 2,000 3,000 0 10,000 20,000 30,000 Net In-Migration by Degree Level and Age Group 22- to 29-Year-Olds 30- to 64-Year-Olds Less than High School High School Some College Associate Bachelor’s Graduate/Professional Total Source: U.S. Census Bureau, 2000 Census; 5% Public Use Microdata Sample (PUMS) Files
New Jersey 17,563 24,903 8,871 4,315 1,901 -2,372 584 1,578 14,901 21,335 12,315 23,792 56,135 73,551 0 10,000 20,000 30,000 40,000 50,000 60,000 -20,000 0 20,000 40,000 60,000 80,000 Net In-Migration by Degree Level and Age Group 22- to 29-Year-Olds 30- to 64-Year-Olds Less than High School High School Some College Associate Bachelor’s Graduate/Professional Total Source: U.S. Census Bureau, 2000 Census; 5% Public Use Microdata Sample (PUMS) Files
New Mexico 1,895 5,060 689 2,714 -2,731 810 -162 501 -1,849 861 464 1,131 -1,694 11,077 -3,000 -2,000 -1,000 0 1,000 2,000 3,000 0 3,000 6,000 9,000 12,000 Net In-Migration by Degree Level and Age Group 22- to 29-Year-Olds 30- to 64-Year-Olds Less than High School High School Some College Associate Bachelor’s Graduate/Professional Total Source: U.S. Census Bureau, 2000 Census; 5% Public Use Microdata Sample (PUMS) Files
New York 34,890 30,416 -40,946 13,303 -56,339 -5,319 -19,698 -2,913 -37,456 24,393 -9,189 19,823 -128,738 79,703 -20,000 0 20,000 40,000 60,000 80,000 -135,000 -90,000 -45,000 0 45,000 Net In-Migration by Degree Level and Age Group 22- to 29-Year-Olds 30- to 64-Year-Olds Less than High School High School Some College Associate Bachelor’s Graduate/Professional Total Source: U.S. Census Bureau, 2000 Census; 5% Public Use Microdata Sample (PUMS) Files
North Carolina 34,517 43,414 23,700 47,524 25,249 44,416 5,747 14,106 24,048 37,318 4,950 30,435 118,211 217,213 0 30,000 60,000 90,000 120,000 0 44,000 88,000 132,000 176,000 220,000 Net In-Migration by Degree Level and Age Group 22- to 29-Year-Olds 30- to 64-Year-Olds Less than High School High School Some College Associate Bachelor’s Graduate/Professional Total Source: U.S. Census Bureau, 2000 Census; 5% Public Use Microdata Sample (PUMS) Files
North Dakota -298 205 -329 -1,443 -1,158 -2,374 -902 -226 -5,812 -2,398 -1,091 -2,543 -9,590 -8,779 -10,000 -8,000 -6,000 -4,000 -2,000 0 -10,000 -8,000 -6,000 -4,000 -2,000 0 2,000 Net In-Migration by Degree Level and Age Group 22- to 29-Year-Olds 30- to 64-Year-Olds Less than High School High School Some College Associate Bachelor’s Graduate/Professional Total Source: U.S. Census Bureau, 2000 Census; 5% Public Use Microdata Sample (PUMS) Files
Ohio 4,118 5,971 5,321 -194 415 2,481 1,609 477 -11,637 558 1,103 -3,981 929 5,312 -12,000 -9,000 -6,000 -3,000 0 3,000 6,000 -4,000 -2,000 0 2,000 4,000 6,000 Net In-Migration by Degree Level and Age Group 22- to 29-Year-Olds 30- to 64-Year-Olds Less than High School High School Some College Associate Bachelor’s Graduate/Professional Total Source: U.S. Census Bureau, 2000 Census; 5% Public Use Microdata Sample (PUMS) Files
Oklahoma 7,476 11,453 3,732 10,834 4,108 6,659 195 1,962 -5,033 -1,831 -1,901 -1,632 8,577 27,445 -6,000 -3,000 0 3,000 6,000 9,000 -5,000 0 5,000 10,000 15,000 20,000 25,000 30,000 Net In-Migration by Degree Level and Age Group 22- to 29-Year-Olds 30- to 64-Year-Olds Less than High School High School Some College Associate Bachelor’s Graduate/Professional Total Source: U.S. Census Bureau, 2000 Census; 5% Public Use Microdata Sample (PUMS) Files
Oregon 11,109 15,366 7,024 13,238 7,962 11,904 2,928 6,126 10,467 13,774 4,090 11,482 43,580 71,890 0 10,000 20,000 30,000 40,000 50,000 0 25,000 50,000 75,000 Net In-Migration by Degree Level and Age Group 22- to 29-Year-Olds 30- to 64-Year-Olds Less than High School High School Some College Associate Bachelor’s Graduate/Professional Total Source: U.S. Census Bureau, 2000 Census; 5% Public Use Microdata Sample (PUMS) Files
Pennsylvania 6,373 11,900 3,667 -177 -89 1,309 -2,051 -656 -32,331 2,588 -2,311 -4,008 -26,742 10,956 -40,000 -30,000 -20,000 -10,000 0 10,000 20,000 -5,000 0 5,000 10,000 15,000 Net In-Migration by Degree Level and Age Group 22- to 29-Year-Olds 30- to 64-Year-Olds Less than High School High School Some College Associate Bachelor’s Graduate/Professional Total Source: U.S. Census Bureau, 2000 Census; 5% Public Use Microdata Sample (PUMS) Files
Rhode Island 2,812 4,565 1,551 228 2,141 433 600 366 -2,804 746 -706 727 3,594 7,065 -4,000 -2,000 0 2,000 4,000 0 2,000 4,000 6,000 8,000 Net In-Migration by Degree Level and Age Group 22- to 29-Year-Olds 30- to 64-Year-Olds Less than High School High School Some College Associate Bachelor’s Graduate/Professional Total Source: U.S. Census Bureau, 2000 Census; 5% Public Use Microdata Sample (PUMS) Files
South Carolina 9,596 15,454 7,060 20,196 6,790 19,484 2,243 8,276 1,456 13,563 -266 9,025 26,879 85,998 -5,000 0 10,000 20,000 30,000 0 30,000 60,000 90,000 Net In-Migration by Degree Level and Age Group 22- to 29-Year-Olds 30- to 64-Year-Olds Less than High School High School Some College Associate Bachelor’s Graduate/Professional Total Source: U.S. Census Bureau, 2000 Census; 5% Public Use Microdata Sample (PUMS) Files
South Dakota -232 1,220 -1,426 1,336 -2,069 727 -452 -257 -4,265 -978 -326 -353 -8,770 1,695 -9,000 -6,000 -3,000 0 -1,500 -1,000 -500 0 500 1,000 1,500 2,000 Net In-Migration by Degree Level and Age Group 22- to 29-Year-Olds 30- to 64-Year-Olds Less than High School High School Some College Associate Bachelor’s Graduate/Professional Total Source: U.S. Census Bureau, 2000 Census; 5% Public Use Microdata Sample (PUMS) Files
Tennessee 12,760 18,803 9,928 25,706 11,483 20,947 3,702 6,034 9,045 13,398 1,901 7,306 48,819 92,194 0 10,000 20,000 30,000 40,000 50,000 0 20,000 40,000 60,000 80,000 100,000 Net In-Migration by Degree Level and Age Group 22- to 29-Year-Olds 30- to 64-Year-Olds Less than High School High School Some College Associate Bachelor’s Graduate/Professional Total Source: U.S. Census Bureau, 2000 Census; 5% Public Use Microdata Sample (PUMS) Files
Texas 87,599 107,160 37,381 43,841 32,295 49,212 10,031 16,838 53,361 56,297 20,148 51,762 240,815 325,110 0 50,000 100,000 150,000 200,000 250,000 0 75,000 150,000 225,000 300,000 375,000 Net In-Migration by Degree Level and Age Group 22- to 29-Year-Olds 30- to 64-Year-Olds Less than High School High School Some College Associate Bachelor’s Graduate/Professional Total Source: U.S. Census Bureau, 2000 Census; 5% Public Use Microdata Sample (PUMS) Files
Utah 8,294 7,870 5,071 4,992 15,093 3,505 3,879 766 -7,434 -110 -2,253 652 22,650 17,675 -10,000 0 10,000 20,000 30,000 -5,000 0 5,000 10,000 15,000 20,000 Net In-Migration by Degree Level and Age Group 22- to 29-Year-Olds 30- to 64-Year-Olds Less than High School High School Some College Associate Bachelor’s Graduate/Professional Total Source: U.S. Census Bureau, 2000 Census; 5% Public Use Microdata Sample (PUMS) Files
Vermont -276 -1,225 370 -121 831 212 17 -616 -3,522 1,522 -57 2,215 -2,637 1,987 -4,000 -3,000 -2,000 -1,000 0 1,000 2,000 -2,000 -1,000 0 1,000 2,000 3,000 Net In-Migration by Degree Level and Age Group 22- to 29-Year-Olds 30- to 64-Year-Olds Less than High School High School Some College Associate Bachelor’s Graduate/Professional Total Source: U.S. Census Bureau, 2000 Census; 5% Public Use Microdata Sample (PUMS) Files
Virginia 15,557 17,368 11,044 14,449 11,962 10,473 3,016 5,618 23,482 23,506 9,082 24,877 74,143 96,291 0 25,000 50,000 75,000 0 20,000 40,000 60,000 80,000 100,000 Net In-Migration by Degree Level and Age Group 22- to 29-Year-Olds 30- to 64-Year-Olds Less than High School High School Some College Associate Bachelor’s Graduate/Professional Total Source: U.S. Census Bureau, 2000 Census; 5% Public Use Microdata Sample (PUMS) Files
Washington 11,403 17,571 11,143 13,012 16,732 17,808 4,656 6,114 20,565 26,878 9,038 22,215 73,537 103,598 0 25,000 50,000 75,000 0 30,000 60,000 90,000 120,000 Net In-Migration by Degree Level and Age Group 22- to 29-Year-Olds 30- to 64-Year-Olds Less than High School High School Some College Associate Bachelor’s Graduate/Professional Total Source: U.S. Census Bureau, 2000 Census; 5% Public Use Microdata Sample (PUMS) Files
West Virginia -185 1,664 -1,404 3,994 -844 1,675 -883 523 -5,903 -1,244 -1,338 -1,485 -10,557 5,127 -12,000 -9,000 -6,000 -3,000 0 -2,000 0 2,000 4,000 6,000 Net In-Migration by Degree Level and Age Group 22- to 29-Year-Olds 30- to 64-Year-Olds Less than High School High School Some College Associate Bachelor’s Graduate/Professional Total Source: U.S. Census Bureau, 2000 Census; 5% Public Use Microdata Sample (PUMS) Files
Wisconsin 6,492 9,418 4,824 9,283 3,740 6,911 486 518 -13,263 4,306 -225 527 2,054 30,963 -15,000 -10,000 -5,000 0 5,000 10,000 0 8,000 16,000 24,000 32,000 Net In-Migration by Degree Level and Age Group 22- to 29-Year-Olds 30- to 64-Year-Olds Less than High School High School Some College Associate Bachelor’s Graduate/Professional Total Source: U.S. Census Bureau, 2000 Census; 5% Public Use Microdata Sample (PUMS) Files
Wyoming 169 -186 538 611 -2,316 127 -190 -101 -1,579 -1,581 76 -484 -3,302 -1,614 -4,000 -3,000 -2,000 -1,000 0 1,000 -2,000 -1,500 -1,000 -500 0 500 1,000 Net In-Migration by Degree Level and Age Group 22- to 29-Year-Olds 30- to 64-Year-Olds Less than High School High School Some College Associate Bachelor’s Graduate/Professional Total Source: U.S. Census Bureau, 2000 Census; 5% Public Use Microdata Sample (PUMS) Files