Download

1 / 26
260 likes | 297 Vues
Sun Spots. The Problem. In 2001 the European Space Agency (ESA), which catalogues and tracks satellites in orbit around the Earth, temporarily lost track of 300 low–altitude satellites.

E N D
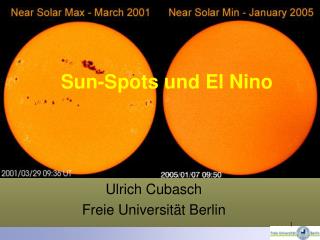
The Problem • In 2001 the European Space Agency (ESA), which catalogues and tracks satellites in orbit around the Earth, temporarily lost track of 300 low–altitude satellites. • This coincided with a period of intense solar activity, signified by the presence of sunspots and associated coronal mass ejections. • In order to make provisions for similar future events, ESA have requested a prediction on when the next period of high solar activity will occur. National Schools’ Observatory
The Sun • Facts about the Sun • The Sun is a yellow dwarf star. • A distance of 1.496 x 10¹¹ m from Earth (approximately 93 million miles). • Consists of predominantly hydrogen (74%) and helium (24%) with trace amounts of other heavier elements including oxygen, iron and carbon. • Accounts for 98.6% of the mass of the solar system. • If hollow, over 1 million earths could fit inside the Sun. • WARNING: Never look directly at the Sun! National Schools’ Observatory
Solar Structure • The Core • 0.0 to 0.2 solar radii. • Very Hot! 13.6 million K. • Very Dense 10% Volume 40% mass. • Majority of the Sun’s energy created in the core by nuclear fusion. Image created by NSO National Schools’ Observatory
Solar Structure • The Radiative Zone • From 0.2 to 0.7 solar radii. • Heat energy from the core is • transferred in this region by • thermal radiation. • Heat transfer in this region is • slow Image created by NSO National Schools’ Observatory
Solar Structure • The Convection Zone • From 0.7 solar radii and up. • The density and temperature of the • solar plasma is low enough for heat • energy transfer to occur by • convection. • Heat transfer occurs much quicker • in this region. • Material that reaches the surface • is cooled and sinks back towards • the radiative zone where it is • heated again. Image created by NSO National Schools’ Observatory
Solar Atmosphere • The Photosphere • Light incident on Earth originates • from this region • Is not the outer most layer and yet is • what is observed to the unaided eye • Temperature of 4000K to 6400K • The region where sunspots are • observed Imagecreated by NSO National Schools’ Observatory
Solar Atmosphere • The Chromosphere • A 2000 km thick visually transparent layer above the photosphere • May be observed with the use of special • filters and appears as a reddish colour • Further from the core but hotter than • the photosphere (4500K to 20,000K) Image created by NSO National Schools’ Observatory
Solar Atmosphere • The Corona • The outer most region of the Sun’s atmosphere. • Consists of a very hot (~2,000,000 K) plasma (ionized gas). • Can extend up to 13 million km from the photosphere. • Visible during an eclipse. • Despite its high temperatures the corona yields very little heat due to its very low density. Image created by NSO National Schools’ Observatory
Surface Features • Granulation • Solar granulation occurs when convection cells leave an imprint on the surface of the photosphere. Image created by NSO National Schools’ Observatory
Surface Features • Prominences and Solar Flares • Large bright features which extend into the corona from the photosphere. • Looped structures which follow magnetic field lines. • Have a life time of days to weeks. • Can break off to form coronal mass ejections (solar flares). Images created by NSO National Schools’ Observatory
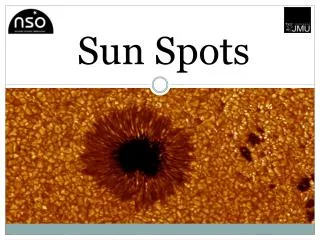
Surface Features • Sun Spots • Appear as darker regions on the photosphere due to their lower temperature • Often linked to other surface features such as prominences • Regions of intense magnetic activity, which causes the inhibition of convective processes Images created by NSO National Schools’ Observatory
Magnetic Fields • Much like Earth, the Sun has a • magnetic field that closely • resembles the magnetic field of a • bar magnet . • The nature of the solar magnetic • field influences solar activity • including Sun spots. • The solar magnetic field changes • over time due to the Sun’s • rotation. Images created by NSO National Schools’ Observatory
The Solar Cycle • The sun differentially rotates, with • faster rotation occurring at the equator. • The rotation rate can be tracked by • watching sunspots. At the equator • it takes 25 days for a spot to complete • one full rotation and between 28 and • 29 days at higher altitudes. • This causes the magnetic field lines to distort. Images created by NSO National Schools’ Observatory
The Solar Cycle • Solar Polarity Change • Solar activity is part of a • relatively consistent cycle • At the peak of each maximum • and minimum, the polarity of the • magnetic field flips • This signals the start of the next • stage in the cycle • The same change in polarity occurs • to the Earths magnetic field but far • less frequently Images created by NSO National Schools’ Observatory
Solar Activity • The Sun’s activity increases and decreases in a cyclical manner. • When the Sun is more active, more sunspots are visible on its surface from the Earth. • By recording and analysing the number of sunspots it is possible to gain an insight into the activity of the Sun. • If results are recorded over longer periods of time, the cyclical nature of solar activity becomes evident and predictions on future activity can be made. National Schools’ Observatory
Prediction • For hundreds of years solar activity has been mapped by the observation of sunspots. • It is clear from this data that over a number of years a cycle of activity occurs. • By observing this, one may be able to predict when the next solar maximum will occur. National Schools’ Observatory
Setting Up the Experiment • Create graphs of data sets for differing periods of time. • One Week • One Month • One Year • Ten Years • Fifty Years • One Hundred Years Sun Spot Number Days Sun Spot Number Sun Spot Number Days Days National Schools’ Observatory
Setting Up the Experiment • Create multiple instances of the data sets for each range where possible. • Pick data sets for each range from periods during the solar minimum, maximum and at some point mid-cycle. Sun Spot Number Days National Schools’ Observatory
Measuring and Recording One Week, One Month and One Year Data • Note the positions of any maxima and minima • Note the positions of any groups of maxima and minima • Take the average number of sun spots for that data set Fifty Years and One Hundred Years • Ignoring smaller changes note the positions in time where solar activity is at a maximum and a minimum • Try to pinpoint the middle of the each maximum or minimum for a more accurate result National Schools’ Observatory
Predictions Compared to Results • Can we make predictions on future solar activity on the data sets recorded over the smaller time scales (i.e. one week, one month, one year) ? • Can we make predictions on future solar activity on the data sets recorded over larger time scales (i.e. fifty years, one hundred years) ? • We predicted that since the solar cycle is fairly consistent that we should be able to predict when solar maxima occur, is this the case? • Using data from the year 2000 and below predict when the maximum occurred in the early 2000’s • Using the whole data set predict when the next maximum will occur. National Schools’ Observatory
Discussion about the Experiment • Which is the best data set to draw conclusions from? • How accurate do you think the prediction for the next maximum is? • Can you predict how intense the next solar maximum will be? • What sources of error are there? • Why carry out the experiment? Images courtesy of NASA National Schools’ Observatory
Why Carry Out the Experiment? Investigating solar variability can: • Enable the prediction of space weather. • Help us understand how solar variability can effect the habitability of planets. • Protect technology such as satellites and ground based communications and power systems. • Ensure greater safety for future space exploration. National Schools’ Observatory
Space Weather • Solar Activity, such as solar flares, can bombard the Earth with high energy • particles • These interact with the Earth’s magnetic field, dumping millions of watts of • electricity into the atmosphere. • This can cause serious damage to satellites, power line surges and disrupt radio • transmissions. Image courtesy of NASA National Schools’ Observatory
Aurora • Aurora are more dramatic and occur • during periods of high solar activity. • Caused by the interaction of solar wind • (high energy particles) with the Earth’s • magnetic field. Images courtesy of NASA National Schools’ Observatory
Questions, Exercises and Tasks • Based on your findings, write to ESA and inform them how long they have to implement their satellite protection strategy. (If alternative presentation used) • How will solar activity effect future space exploration? • Where is the best place to view the aurora? National Schools’ Observatory