ATTC Network Workforce Study
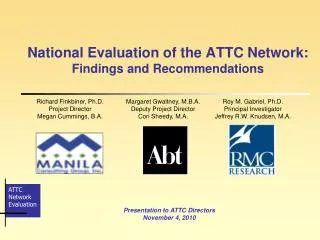
ATTC Network Workforce Study. ATTC Workforce Meeting. Resources versus Rigor. SCIENTIFIC RIGOR. RESOURCES. RESOURCES. NSTTATS List Counselors 85% RETURN RATE Cash Incentives Face 2 Face Interviews Telephone Follow-ups. QUALITATIVE STUDIES. One Time Mailing No Follow-Up


ATTC Network Workforce Study
E N D
Presentation Transcript
ATTC Workforce Meeting
Resources versus Rigor SCIENTIFIC RIGOR RESOURCES
RESOURCES NSTTATS List Counselors 85% RETURN RATE Cash Incentives Face 2 Face Interviews Telephone Follow-ups QUALITATIVE STUDIES One Time Mailing No Follow-Up No Incentives No Master List RIGOR NSTTATS LIST Clinical Directors 60% RETURN RATE Incentives Online Survey
Surveying the Treatment Workforce:Lessons Learned Hannah K. Knudsen, Ph.D. University of Kentucky Department of Behavioral Science
A Pragmatic Perspective on Research Design(Knudsen, 2010) Methodology should be valid, reliable and efficient way to address the research questions Identifies respondents who possess the desired information Effectively recruits a high percentage of participants Measures are easy to understand accurate data Respondents’ time should be respected
A Pragmatic Perspective on Research Design(Knudsen, 2010) • First priority must be on the central research questions • Can’t measure everything—tough choices have to be made • Design these measures first, pre-test it for length, then decide if other topics can be added
Selected Issues Task 1: Identify the Target Population Task 2: Determine the Survey Sample Task 3: Determine Data Collection Technique Task 4: Strategize to Increase Response Rates Knudsen, 2010
Identify the Target Population:Who Should Complete the Survey? Knudsen, 2010
What About Bob Knudsen, 2010
Clinical Directors Knudsen, 2010
Determine the Survey Sample:Identifying Programs and Estimating the Sample Size Knudsen, 2010
How To Sample: Simple Random Sample National Database: Every program in I-SATS is assigned an ID number Use a random number generator to randomly select facilities Number of facilities to invite = Desired final sample size / expected response rate Result: Data that is representative of the nation as a whole Limitation: Might not have large enough samples for region-specific analyses Knudsen, 2010
Region-Specific Samples:Preliminary Steps Enumerate the number of I-SATS facilities per state, then aggregate to ATTC regions Calculate % facilities in each region Consult a statistician re: minimum final sample size for the smallest region Calculate appropriate N for each of the other regions to achieve representativeness Regional Databases: All facilities in given region receives an ID number; random number generator to select facilities for recruitment Number of facilities to invite in a region = Desired final sample size for that region / expected response rate Knudsen, 2010
Final Decision about Sample Size Need to consult a statistician to conduct power analyses Simple random sample (national) Sample size for region-specific analyses (what is the minimum sample size for the smallest region, that would still yield valid/reliable results?) Weigh the costs and benefits in light of available resources Knudsen, 2010
In order to get state level data need about 3,750 respondents nationally 80% Response Rate Knudsen, 2010
Determine Data Collection Technique Knudsen, 2010
Mailed Surveys Lower response rates (55-60% with $20-$40 incentive paid after completion) Possible first-line strategy to recruit “low-lying fruit” A “second-line strategy” for non-respondents to a web-based survey? Knudsen, 2010
Web-based Surveys Can be cheaper than mailed surveys, but still incurs costs for recruiting & programming Saves on data entry because collection & entry is simultaneous Skip patterns in the survey may be easier for respondents to navigate Careful attention to recruitment strategy is still necessary Steps for identifying the respondent (Calling to get for the name? Speaking with the respondent so they know the survey is coming?) Method for inviting them into the study (By mailed letter with the URL? Email?) If by email, how do you avoid the spam filter? Do you include a “read receipt”? A clear protocol for recruitment is key Knudsen, 2010
Additional Considerations for Web-Based Surveys Will you allow respondents to “save their work” (i.e. complete it in more than 1 sitting)? If so, will you embed downloadable “worksheets” for complex questions, allowing the respondent to gather information & return to the survey? Will you allow respondents to download a pdf version of the survey so they can print/complete/mail it? Knudsen, 2010
Strategize to Increase Response Rates:Incentives Aren’t the Only Way Knudsen, 2010
Why does the response rate matter? Risk that non-responding programs differ from responding programs Risk that means/standard deviations of variables will be wrong Most inferential statistics begin with means, so if those are wrong, you run the risks of: Finding associations that aren’t real Missing associations that are real Reviewers tend to see it as a proxy for study quality Knudsen, 2010
General rule: Higher response rate is better Knudsen, 2010
Small incentives are better than no incentives Knudsen, 2010
Decide whether incentive goes to the individual or to the program Knudsen, 2010
Final Thoughts… The research questions guiding the Workforce Survey are vital for the future of the field Focusing on “unanswered questions” that haven’t been addressed in the literature may be a more efficient use of resources Clinical directors can identify the critical needs facing the specialty treatment system Knudsen, 2010
This is important work, and it can be done Knudsen, 2010
Identifying Pathways to Examine and Strengthen our Profession:An ATTC Workforce Study Sponsored by SAMHSA-CSAT 1st Title
Identifying Pathways for a Stronger TomorrowAn ATTC Workforce Study Sponsored by SAMHSA-CSAT 2nd TITLE
Internal Marketing • Webinars • Develop standard templates for emails and letters • Standard PPT Presentations used to present to stakeholders • email banners • Banners for websites
External Marketing • Exposure and awareness raising at conferences • Letters • Letter from SAMSHA/CSAT to SSAs (after NASADAD) • ATTCs follow-up with own letter/email from to SSA • Letter/email from SSAs to Tx providers • PPT slides for SSAs to include in their presentations
Products • Interactive PDFs at “teasers” • Ask partners, stakeholders to post interactive PDF on website, e-newsletter • Tie into Recovery Month, utilize their strategies • Develop a web banner, various options – one static, flash • Tie into “labor day” … • Exhibit bags • Postcards • Standard PPT Presentations for ATTCs
Potential Conferences • SAAS/NIATx • NASADAD • FTCC Meeting • NIDA Blending Conference (teaser) • Regional Conferences • CTPs • Women’s Conference • NAADAC • Regional Conferences • DSCA
General WIIFMs Given economic climate, this is still priority to SAMHSA – demonstrates importance/need for survey
SSAs WIIFMs • Can use report to influence legislatures • Will have a report in your hands to provide comparison of your State with other States • Will provide you with your own State data • Inform your strategic plan • Projected growth rate – plan for recruitment, retention • Can help drive different programs – loan forgiveness