Download
1 / 55
610 likes | 1.49k Vues
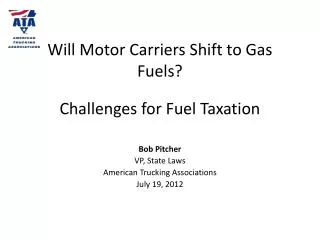
Motor Carriers. Brief History. Important role of the economy during 20th century as well as 21st century. Emerging from World War I Railroad have difficulty with small shipments that had to be moved short distances, encouraged the early motor carrier entrepreneurs. Brief History.

E N D
Brief History • Important role of the economy during 20th century as well as 21st century. • Emerging from World War I • Railroad have difficulty with small shipments that had to be moved short distances, encouraged the early motor carrier entrepreneurs.
Brief History • U.S. spent more than $120 billion to construct its interstate highway system • 1956, President Eisenhower signed a bill to establish the National System of Interstate and Defense Highways, which was to be funded 90 percent by the federal government through fuel taxes.
1950, railroad industry moved 1.4 billion tons of freight on an intercity basis, whereas motor carriers moved 800 million tons. • 1980, railroad moved 1.6 billion tons, compared to more than 200 billion tons by motor carriers. • By 2001, motor carriers were handling 4.1 billion tons, compared with 2.1 billion tons by rail. • On a relative basis, however, the railroads did stabilize their market share.
In Taiwan • Superhighway
Industry Overview • Significance • In 2002, the US paid over $585.3 billion for highway transportation, approximately 86.5 percent of the total 2002 Nation’s Freight Bill. • In 2001, 10.51 billion revenue freight ton-miles, or 28 percent of the ton-miles transported by all modes. • During 2001, approximately 1.8 million people were emplyed in the motor carrier industry, $40365 average annual compensation • Logged 442.1 billion miles used for business purposes in 2002 (excluding the government and farm sectors) • These indicate the importance of motor carrier.
Types of Carriers • For-hire vs. private • For-hire carrier provides services to the public and charges a fee for the service. • Private carrier provides a service to the industry or company that owns or leases the vehicles, and thus does not charge a fee, but obviously the service provider incurs cost. • Private carriers might transport commodities for hire, but when operating in such a capacity, the private carrier is really an exempt for-hire carrier.
For-hire carriers can be either local or intercity operators, or both. • The local carriers pick up and deliver freight within the commercial zone of a city. • For-hire carriers may be common and/or contract operators. • Common: serve the general public upon demand, at reasonable rates, and without discrimination. • Contract: serve specific shippers with whom the carriers have a continuing contract; thus, is not available for general public use.
Contract carriers also typically adapt their equipment and service to meet shipper needs. • Shippers must choose to use a commercial carrier or to operate their own private fleet. Trade-offs exist for both options, but it will ultimately be determined by the needs of the shippers.
Truckload (TL) vs Less-than-truckload (LTL) • TL: provide service to shippers who tender sufficient volume to meet the minimum weights required for a truckload shipment and truckload rate or will pay the difference. • LTL: provide service to shippers who tender shipments lower than the minimum truckload quantities, such as 50 to 10,000 pounds. • LTL carrier must consolidate the numerous smaller shipments into truckload quantities for the line-haul (intercity) movement and disaggregate the full truckloads at the destination city for delivery in smaller quantities. • In contrast, the TL carrier picks up a truckload and delivers the same truckload at the destination.
Heavy LTL • A hybrid type of carrier • Shipment sizes carried by this type are in the upper end of what can be considered LTL shipments (i.e., 12,000 to 25,000 pounds) • Utilizes consolidation terminals (like LTL carriers) to fully load trailers but does not utilize break-bulk facilities for deliveries. • It delivers from the trailer, much like a “pool” carrier, charging line-haul rates plus a charge for each stop-off (like TL carriers). • Specializes in shipment sizes less than the TL carriers haul and more than LTL carriers haul. Has some fixed costs but not as much as in the LTL industry.
Number of Carriers • In 2002, a total of 585,677 interstate motor carriers were on file with the Office of Motor Carriers. 81 percent operate with six or fewer vehicles. (p.99) • A motor carrier can be formed with as little as $5,000 to $10,000 equity, however, LTL carriers have terminals that increase the capital requirements and thus add a constraint to entry.
The LTL segment of the motor carrier industry requires a network of terminals to consolidate and distribute freight, called a “hub-and spoke” system. • Because of this relatively high level of fixed costs, the LTL industry has continued to consolidate. • In August 2003 Yellow Corporation announced that it would buy Roadway Corporation for $1.1 billion. They control approximately 20 percent of the national LTL carrier market.
LTL operation • Shippers that have shipping requirement that are small-use LTL carriers (for example, the cubic capacity of a 53-foot trailer is not needed for the shipment). • Also, the LTL shipper typically has shipments headed for more than on destination. • The LTL carrier collects the shipments at the shipper’s dock with a pickup and delivery (PUD) vehicle. After a PUD vehicle is finished collecting and delivering shipments, it returns to a consolidation or break-bulk facility.
LTL operation • Then sort packages by their final destination. • Next, line-haul segment. Shipments are loaded into 28-foot, 48-foot, or 53-foot trailers. • After line-haul, unloaded at another break-bulk facility and are then sorted and reloaded into a PUD vehicle to be delivered to the receiver.
Market Structure • Motor carrier vehicles, both for-hire and private, primarily transport namufactured, high-value products. • Includes food products and manufactured products, consumer goods, and industrial goods. In addition, almost all the sheep, lambs, cattle, calves, and hogs to stockyards. • Transport less of commodities such as grain, primary nonferrous(不含鐵的) metal products, motor vehicles and equipment, and paper and allied products. Because such commodities generally must move long distances and in large volumes, by rail and water is usually less expensive.
Competition • Vigorously with one another for freight. • For-hire motor carriers, rivalry (=competition) between firms can be intense. However, most severe competition comes from the private carrier. • Few capital constraints to entry. Thus, freedom of entry, discounting, and lack of regulatory constraints appear to dominate the industry and suggest that competition between firms can control the industry.
Even though the LTL segment is more concentrated, there is still intense competition between the top carriers. Other competitors also include United Parcel Service (UPS), FedEx, and FedEx Ground.
LTL carrier must invest in terminals and freight-handling equipment that are simply not needed by the TL carrier. • Special equipment carriers – carriers of liquefied gases or frozen products – usually have larger investments in equipment and terminals than those involved with general freight. • For contract carriers market oriented meeting customer requirements has been a common trait.
Operating and Service Characteristics • General Service Characteristics • Accessibility – can provide service to virtually any location • Motor carriers provide the bridge between the pickup and delivery point and the facilities of other modes • Speed – going under 500 miles, motor can deliver the goods in less time than other modes. Airline fast in line haul but slow in get freight to and from the airport, worse part, the fixed schedules of the air carriers (may have scheduled only one flight per day 24 hours for waiting)
Compared to the railcar and barge, the smaller cargo-carrying capacity of the motor carrier vehicle enables the shipper to use the TL rate, or volume discount, with a lower volume. • Many TL minimum weights are established at 20,000 to 30,000 pounds. Rail carload minimum weights are often set to 40,000 to 60,000 pounds, and barge are set in terms of hundreds of tons. • Smaller shipping size provides benefits of lower inventory levels, lower inventory-carrying costs, and more frequent services.
Smoothness of transport suspension system and the pneumatic (充氣的) tires used on their vehicles, smoother than rail and water transport, less likely to result in damage to the cargo. This relatively damage-free service reduces the packaging requirements and thus packaging cost. • In 2001, interstate truckload had an average haul length of 294 miles, LTL 752 miles per trip, railroads 735 miles in average, airlines 900 miles.
Equipment • High degree of flexibility, the relatively smooth ride, and the small carrying capacity of the vehicle result in greater accessibility, capability, frequency of delivery and pickup, cargo safety, and lower transit time. • Loaded quickly – railroad operation needs to collect a number of freight cars to be pulled by the one power unit; the motor carrier has just one or two. Eliminates the time needed.
The other dimension of equipment flexibility – lack of highway constraint. Unlike the railroad and water carriers, the motor carrier is not constrained to providing service over a fixed railway or waterway. • However, gross vehicle weight and axle weight restrictions on vehicles while traveling the highway system.
Seasonal influences such as holidays or harvest times must also be considered, as they can drastically alter demand. • TL and LTL carriers need to make two types of equipment decisions: what type of tractor (power) and what type of trailer. • LTL carriers need to position certain types of equipment at certain terminals.
Types of Vehicles • Line-haul or city vehicles • Line-haul: usually a tractor-trailer combination of three or more axles (p. 105) • Have their weight limits.
City straight trucks • Normally smaller and single units. • Special vehicles: • Dry van: all sides enclosed • Open top: top is open to permit loading of odd-sized freight • Flatbed: not top or sides; used extensively to haul steel • Tank trailer: for liquids such as petroleum products • Refrigerated vehicles: controlled temperature • High cube: cargo unit is higher than normal to increase cubit capacity • Special: unique design for special commodity, such as liquefied gas or automobiles
Terminals • TL: might not require terminals, may use the shipper’s plant for loading and consignee’s plant for unloading. Typically provides dispatching, fuel, and maintenance services in TL terminal. Some provide restaurant and hotel to give their drivers alternatives to truck stops. These terminals are for drivers and equipment, but not freight. • Heavy LTL carriers use terminals for loading, or consolidation, only. Some large LTL carriers have more than 400 terminals.
Pickup and delivery terminals (PUD) • PUD, also called satellite or end-of-the-line (EOL) terminals. Serves a local area and provides direct contact with both shippers and receiver. Provide pickup and delivery of freight on peddle runs. • A peddle run is a route that is driven daily out of the PUD terminal for the purposes of collecting freight for outbound moves or delivering freight from inbound moves.
Two elements of a peddle run, one called stem time and the other called peddle time. • Stem time: from when the driver leaves the terminal until the driver makes the first pickup or delivery; it is also the time that elapses from when the driver makes the last pickup or delivery until returning to the terminal. (nonrevenue-producing time) • Peddle time: the time during which the driver is actively involved in the pickup and delivery of freight. (revenue-producing time)
Basic terminal services: consolidation and dispersion • Freight can be picked up on peddle runs in one of two ways. First, a standing order for a pickup every day at 10 a.m. for example, customer has no need to notify the carrier in advance for the pickup. • Second, call the local PUD terminal to order service for a pickup. This is where the local dispatcher becomes involved.
The dispatcher records the nature of the shipment and required time of pickup and assigns that shipment to the driver on the appropriate peddle run. The PUD driver will periodically call in to the dispatcher to determine the order and frequencies of new pickup requests. • Obviously, the dispatcher needs to be familiar with the geography of the peddle runs and the capacity of the PUD drivers and trailers to efficiently route freight with the appropriate vehicle.
Other services • Tracing • Rating and billing • Sales • Claims • Some carriers are beginning to centralize these functions at break-bulks or other locations by taking advantage of telecommunications technology (eg the Internet).
Break-Bulk terminals • Performs both consolidation and dispersion (or break-bulk) services. • Customers have rarely contact with the operations • Main purpose is to provide an intermediate point where freight with common destinations from the PUD terminals is combined in a single trailer for movement to the delivering PUD terminal. • Break-bulk facilities also serve as driver domiciles. Line-haul drivers might or might not be able to return home after a trip, depending on the length of haul they are assigned.
Relay Terminals • Freight is never touched in relay terminals • Necessitated by the maximum hours-of service regulation that is imposed on drivers. • DOT enforcement: drivers were permitted to driver a maximum of 10 hours after 8 consecutive hours off duty. • At the relay terminal, one driver substitutes for another who has accumulated the maximum hours of service. • Alternative: a sleeper team – two drivers.
Terminal Management Decisions • Number of terminals • Relatively simple decision: for example, close to major population centers • Railroads must also make this decision but are limited by geography and track locations for terminal sites. Railroads will not normally have many terminals in their networks. • LTL: probably the most difficult decision, because of the vast numbers of terminals and the relatively small investment needed to develop a terminal site.
How many terminals should we have? • The degree of market penetration and customer service desired by the carrier will help determine the number of terminals to establish. • In theory, the more terminals, the closer to the customer, the better the service. • Realistically, at some point additional terminals will result in no incremental increase in service and might even detract from service.
The dilemma of small terminal versus long peddle must be addressed. Small: service less customers will shorter distance, but need to establish more terminals. Bigger terminal service more customers (less terminals needed) but will have longer stem time. • For distribution system decisions, assume that manufacturing facilities are fixed and that warehouse decisions must be made based on this fixed network. Similar to the terminal decision for LTL motor carriers, except their “manufacturing facilities” are break bulk terminals.
Locations of Terminals • Can be relatively simple because of geographic, government, and demand variables. • LTL must consider some others • The DOT limits the amount of time a driver can continuously operate a vehicle before a rest period is required (11 hours currently) • PUD terminals should be located to minimize the distance that freight would need to be backhauled to the break-bulk (need to decide which break-bulk to send so that the travel distance can be minimize) • Market penetration and potential will help determine terminal location. Getting closer to the customer can many times improve the level of service
Cost structure • Fixed vs. variable • High levels of variable costs and relatively low fixed costs • Approximately 70 to 90 percent is variable, low fixed cost: • public investment in the highway system • Motor carrier is able to increase or decrease the number of vehicles used in short periods of time and in small increments of capacity. • Carriers as a group (except LTL carrier) do no require expensive terminals
Daily operating costs – the variable costs of fuel, wages, maintenance, and highway user fees (e.g., fuel tax, vehicle registration) • In 2001, operate a tractor-trailer was 207.1 cents per mile. As indicated, approximately 80 percent of the cost to operate an intercity tractor-trailer is the variable. The remaining 20 percent is associated with the fixed costs of: vehicle interest; depreciation and interest on terminals, garages, and offices; management; and overhead (such as utilities). • Labor & fuel: largest share of the variable costs
Labor • 19 percent of the total costs per vehicle mile • Usually absorb about 41 percent of a carrier’s revenue dollar. 41 cents out of one dollar. Average annual wage in 2001: $40365 • The over-the-road (intercity) driver is typically paid on a mileage basis, such as 32.5 cents per mile. Local drivers paid by hour. • DOT enforces maximum hours of service regulation. 11 hours after 10 consecutive hours off duty. 60 hours on duty in 7 consecutive days, or 70 hours in 8 consecutive days.
Most pressing labor issue, particularly TL carriers: the shortage of qualified drivers. • Vehicles over 26,000 pounds gross vehicle weight must hold a commercial driver’s license (CDL) • Poor driving records and inability to pass the CDL test eliminated many marginal drivers. • Availability of drivers • Frequently away from home for long periods and often have to assist with the loading and unloading of trailers • Life-style is not as attractive as other career choices • to help on driver retention and recruitment. • Raised the per-mile and per-hour pay rates, • scheduled drivers home more frequently, • and worked with shippers and consignees to make freight more “driver-friendly” (i.e., easier to load/unload, tarp(防水布), brace(支架), etc.)
Fuel • In 1976 fuel cost was 11.6 cents per mile or 19.8 percent of the total cost per mile • In 1985 fuel cost was 24.6 cents per mile or 21.1 percent of total cost • In 2001 fuel cost was lower at 17.3 cents per mile or 8 percent of total cost • Today?......fluctuations in supply • 53 cents per gallon in 1976 to about $1.49 per gallon in 2003 • Fuel tax plus other taxes for highway use are payments made by the carrier to the government for the construction, maintenance, and control of the highways. In 2002 the motor carrier industry paid $30.7 billion in federal and state highway user taxes. • The federal fuel tax is 24.4 cents per gallon of diesel fuel plus a state average of 21.9 cents per gallon.
Economies of Scale • Operational cost trade-offs exist between large and small carriers. • A large-scale operation affords savings in purchase economies of equipment and in such inputs as fuel, parts, and interest in loans. (The small carrier might enjoy some of these purchase economies from larger retailers of motor carrier vehicle suppliers) • On the other hand, large LTL motor carriers might be unionized and thus pay higher labor rates, but the motor carrier industry is less unionized today than it was in 1980.
Operating ratio • The percent of operating expenses to operating revenue • Operating ratio = (operating expenses/operating revenue)*100 • Operating expenses are those expenses directly associated with the transportation of freight, excluding nontransportation expenses and interest costs. • Operating revenues are the total revenues generated from freight transportation services; nontransportation services are excluded. • The closer the operating ration is to 100, the more indicative of the possible need to raise rates to increase total revenues.
An operating ration of 94 indicates that 94 cents of every operating revenue dollar is consumed by operating expenses, leaving 6 cents of every operating dollar to cover interest costs and a return to the owners. • LTL operating ratios usually range between 93 and 96, whereas the TL could see rations in the low to mid 80s. • Obviously, if the operating ratio is equal to or greater than 100, there is no revenue available to cover fixed or overhead costs or to return a profit to owners or stockholders.
Funding • Highway users – motor carrier vehicle and automobile operators – pay for the construction, maintenance, and policing of highways through highway user taxes. Payment is Depending on the use of highway. This situation contributes to the high variable cost structure of the motor carrier. • General public benefits from increased mobility and the availability of a wide variety of goods and services, the motor vehicle user is presumed to be the major benefactor and therefore is expected to pay a larger share of the costs. • The central issue is whether motor carriers should pay for the added construction and maintenance costs caused by their heavier weight.
Current issues • Safety • Improved safety can mean improved profitability • Deficiencies in safety can tranlate into decreased profitability because of expensive claims for lost or damaged goods, increased insurance premiums(加價), accidents, fines, and so on. • Safety rating by FMCSA • Many shippers seek safety fitness information as part of their selection process, so there is considerable pressure on carriers to operate safely.
A major related concern is that of alcohol and drug abuse • It has been estimated that American industry pays $50 to 100 billion for the effects and results of substance abuse in the workplace every year, either for the cost of accidents or losses in productivity. • Drug and alcohol testing are required in the following circumstances: • As a requirement for employment • As a part of a regular physical exam required of current employees • For “cause(訴訟),” required after any accident • On a random selection basis