Motor Carriers
Motor Carriers. Intercity Trucking Ton-Miles. Intercity Trucking Tons. Significance of the Industry. 2.4 million jobs in 1998 Average compensation = $ 37,036 Trucks logged 353 billion miles for business purposes (does NOT include government and farm)

Motor Carriers
E N D
Presentation Transcript
Significance of the Industry • 2.4 million jobs in 1998 • Average compensation = $ 37,036 • Trucks logged 353 billion miles for business purposes (does NOT include government and farm) • US paid over $120 billion for highway transportation (1998) – 86% of the nation’s total freight bill.
Types of Motor Carriers • For-hire • Provides services to the public & charges a fee for the service • Local vs. Intercity Operators • Local carriers pick up & deliver freight within the commercial zone of a city • Intercity carriers operate between specifically defined commercial zones. • The two often work in conjunction
Types of Motor Carriers • Private Carriers • Provides a service to the industry or a company that owns or leases the vehicles, but does not charge a fee. • May transport commodities for-hire • In this capacity, the private carrier is really an exempt for-hire carrier.
Types of Motor Carriers • Exempt Carriers • Specifically exempt from economic regulation • Gains this status by • Type of commodity hauled (I.e., agricultural commodities) • Nature of its operations (incidental to air transportation)
Types of Motor Carriers • Common Carriers • Required to serve the general public upon demand, at reasonable rates, & without discrimination. • Contract Carriers • Service specific shippers with whom the carriers have a continuing contract. • Thus, typically not available for public use
Types of Motor Carriers • Truckload (TL) Carriers • Provide service to shippers who tender sufficient volume to meet the minimum weights required for a full truckload shipment and TL rate (or who will pay the required amount). • Less-than-Truckload (LTL) Carriers • Provide service to shippers who tender shipments lower than minimum truckload quantities, such as 50 to 10,000 lbs. • Consolidate numerous smaller shipments into TL quantities for Intercity transport • Disaggregate TL shipments at destination for delivery in smaller quantities.
Number of Carriers • 458,634 interstate motor carriers were on file with the Office of Motor Carriers in 1998. • 70% operate with 6 or fewer trucks. • Does not include private fleets.
General Service Characteristics • Offers highest Accessibility of any mode • Can serve virtually any location • Not constrained by waterways, rail tracks, or airport locations • Almost every shipping & receiving locations is accessible via highways
General Service Characteristics • Speed • For loads traveling less than 500 miles, usually can deliver in less time than any other mode • Even over 500 miles, can be, in the right situation, faster than air • For example, shipment traveling 600 miles • Truck = 12 hours (600 miles @ 50 mph) • Air could take up to 24 hours • Flight time = 1 ½ hours • 3 hours needed for pickup and another 3 for delivery • If only 1 flight per day is scheduled, shipment might have to wait 24 hours before it lifts off.
General Service Characteristics • Cargo-Carrying Capacity • Though smaller than many other modes, shippers can enjoy the TL rate (volume discount) with a lower volume. • Most TL minimums set at 20,000 – 30,000 lbs • Rail carload minimums are often set at 40,000 – 60,000 lbs. • Barge (water) minimums are set in terms of hundreds of tons • Smaller shipping size provides buyers and sellers with • Lower inventory levels • Lower inventory-carry costs • More frequent services
General Service Characteristics • Smoothness of Transport • Given the suspension system and pneumatic tires used on trucks, motor carriers offer smoother rides than rail or water • Results in less damage to the cargo (though some does occur) • Less damage results in reduced packaging requirements and thus packaging costs • Customer Focus • By it’s very nature, the industry tends to be more customer- or marketing-oriented • Due in large part to the small size of most carriers (must offer higher service to compete)
Types of Vehicles • Line-Haul Trucks • Tractor-trailer combination of 3 or more axles • Capacity depends on size (length) and state maximum weight limits • Most states now allow tractor-trailer combos with 5 axles that can haul a maximum of 80,000 lbs gross weight (110,000 in Michigan) • Most vehicles weigh (empty) 30,000 lbs, leaving a maximum net payload of 50,000 lbs or 25 tons. • Anything over 5 axles generally requires a special permit • Capacity is also affected by the density of the freight • A 53’ x 8’ x 8’ trailer has 3,392 cubic feet of space • If the commodity hauled has a density of 10 lbs per cubic foot, the maximum payload for the vehicle would be 33,920 (3,392 cubic feet x 10 lbs./cubic foot)
Types of Vehicles • City Trucks • Normally smaller than line-haulers and are single units • Typically 20 to 25 feet long with a cargo unit 15 to 20 feet long. • There is growing use of small trailers that are 20 to 28 feet long.
Types of Vehicles • Special Vehicles • Dry Van • Standard trailer or straight truck with all sides enclosed • Open Top • Trailer top is open to permit loading of odd-sized freight through the top • Flatbed • Trailer has no top or sides; used extensively to haul steel, lumber, etc. • Tank Trailer • Cylinder trailer used to haul liquids
Types of Vehicles • Special Vehicles • Refrigerated Trailers (Reefers) • Cargo unit with controlled temperatures • High Cube Trailer • Cargo unit has drop-frame design or is higher than normal to increase cubic capacity • Special • Vehicle with a unique design to haul a special commodity; such as liquefied gas or automobiles
Terminals • Pickup and Delivery (PUD) Terminals • Freight is collected from shippers and brought to the PUD terminal where it is consolidated with other loads going in the same direction or to the same destination. • Consolidated shipments loaded onto a line-hauler for transport to the destination terminal. • At the destination terminal, line-hauler is emptied, and the combined shipments are separated and reloaded unto city trucks. City trucks then deliver the shipments to the ultimate consignee.
Terminals • Pickup and Delivery (PUD) Terminals • PUDs are also used for • Sales, billing, and claim handling • Limited vehicle maintenance • Change freight from one carrier to another • PUDs are also called end-of-line terminals.
Terminals • Break-Bulk Terminals • Basic function is the separation of combined shipments • Freight is unloaded from consolidated truckloads, sorted by destination, and reloaded for dispatch to destination. • Generally, break-bulk terminals are centrally located within the carrier’s operating scope and at the junction of major east-west and north-south highways. Provides greater efficiency.
Terminals • Relay Terminals • Unlike PUDs and Break-Bulk terminals, the freight is never touched at a relay terminal. • Necessitated by the maximum hours-of-service regulation that is imposed on drivers. • 10 hours maximum driving after 8 consecutive hours off-duty. • At the relay terminal, one driver substitutes for another (hence, the term slip seat that is also used for relay terminals) • Relay terminals are normally located within a maximum of 10 hours driving time from the point of origin. • Alternative to the relay terminal is the sleeper team – 2 drivers.
Cost Structure • Approximately 70 to 90 % of motor carrier costs are variable. • Allows the carrier to increase/decrease the number of vehicles used in short periods of time and in small increments of capacity. • Low fixed costs due to • Public financing of the highway system • Terminals are less expensive than those used by other modes • Bulk of the carrier’s cost is associated with daily operating costs – fuel, wages, & maintenance • In 1995, average total cost to operate a tractor-trailer was 130.2 cents per mile (70% of which was variable costs
Labor • Accounts for 29% of total costs per vehicle mile • Usually absorb about 50% of a carrier’s revenue dollar. • Average annual wage (1997) was $37,036 • Average hourly compensation was $12.83 • Typical over-the-road driver paid 32.5 cents per mile • Local drivers paid by the hour • Driving Time Regulations (USDOT) • 15 hours on-duty after 8 hours off-duty • 10 hours driving after 8 hours off-duty • Cannot accumulate more than 60 hours on-duty in 7 consecutive days, or 70 in 8.
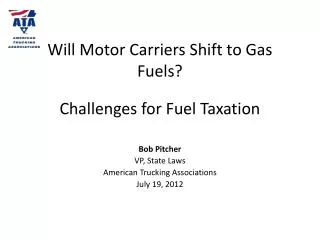
Fuel • 130% increase in diesel fuel prices from 1976 to 1985 • 1976: 11.6 cents/mile (19.8% of total cost/mile) • 1985: 24.6 cents/mile (21.1% of total cost/mile) • 1995: 19.2 cents/mile (14.7% of total cost/mile) • Fuel Taxes • Primary reason for growth in fuel costs • Motor carrier industry paid $23.8 billion in federal and state highway user taxes in 1995 • Federal Fuel Tax is 24.3 cents per gallon • States tack on anywhere from 2 cents to 24.5 cents per gallon • Thus, total tax on a gallon can be as high as 48.8 cents (out of average total cost of $1.10/gallon)
Operation Ratio • Measure of operating efficiency used by motor carriers. • Function of operating expenses and operating revenues • Operating expenses are those expenses directly associated with the transportation of freight, excluding non-transportation expenses and interest costs. • Operating revenues are the total operating revenues generated from freight transportation services. • The closer the ratio is to 100, the more indicative of the possible need to raise rates to increase total revenues. • For example, an operation ratio of 94 means that 94 cents of every operating revenue dollar is consumed by operating expenses. • This only leaves 6 cents to cover interest costs and provide a return to the owners. • Operation ratio for most motor carriers generally range between 93 and 96.
Operation Ratio Operating expenses Operation Ratio = X 100 Operating revenues