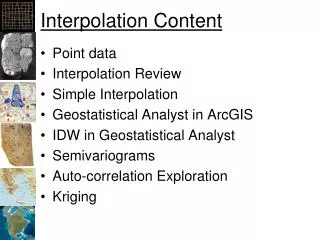
Improved Interpolation Results Analysis for Annual Data Trends
160 likes | 258 Vues
This study analyzes interpolated results from Daily to 1-in-4 day frequencies, comparing baseline and trends for various species using cubic spline interpolation.

Improved Interpolation Results Analysis for Annual Data Trends
E N D
Presentation Transcript
IMPROVE Interpolation Results 12/20/12 Jenny Hand
Description and Method • Daily (1 in 3 day) IMPROVE RHR (second algorithm) data through 2010 were downloaded from FED. Only a simple completeness criteria was applied (75% completeness) but no RHR patching, etc. • Data were interpolated using a cubic spline interpolation algorithm. • Different sampling frequencies were chosen (every day, 1 in 4 day, 1 in 5 day) and the 20th percent haziest and cleanest values were computed using those data. • Baseline (BL) (2000-2004) and Period 1 (P1) (2005-2010) averages were computed for each sampling frequency. • Trends (2001-2010) were computed for each sampling frequency. • Only the 1 in 4 day results for totbextand dv are included here, although all of the other species were analyzed. • “Original” refers to the 1 in 3 day data, “Test” refers to 1 in 4 day.
Example of 1 in 3 day IMPROVE data with interpolation (in red) for 2001, Acadia.
Scatter plots of original and 1 in 4 day 20% cleanest and haziest Totbext, dv for BL and P1. Only the 110 RHTS are included.
20% Cleanest Totbext 20% Haziest Baseline Period 1
20% Cleanest 20% Haziest dv Baseline Period 1
Isopleths of original and 1 in 4 day 20% cleanest and haziest Totbext, dv for BL and P1
Baseline and Period 1 20% cleanest original and 1 in 4 Totbext Interpolated 1 in 4 day “Original” (1 in 3 day) BL BL P1 P1
Totbext Baseline and Period 1 20% haziest original and 1 in 4 “Original” (1 in 3 day) Interpolated 1 in 4 day BL BL P1 P1
dv Baseline and Period 1 20% cleanest Original and 1 in 4 Interpolated 1 in 4 day “Original” (1 in 3 day) BL BL P1 P1
dv Baseline and Period 1 20% haziest original and 1 in 4 Interpolated 1 in 4 day “Original” (1 in 3 day) BL BL P1 P1
Isopleths of 2001-2010 trends in original and 1 in 4 day 20% cleanest and haziest Totbext, dv for BL and P1
Totbext 2001-2010 Trends in 20% cleanest original and 1 in 4 day Interpolated 1 in 4 day “Original” (1 in 3 day)
Totbext 2001-2010 Trends in 20% haziest original and 1 in 4 day Interpolated 1 in 4 day “Original” (1 in 3 day)
dv 2001-2010 Trends in 20% cleanest original and 1 in 4 day Interpolated 1 in 4 day “Original” (1 in 3 day)
dv 2001-2010 Trends in 20% haziest original and 1 in 4 day Interpolated 1 in 4 day “Original” (1 in 3 day)