CARDIAC ACTION POTENTIAL
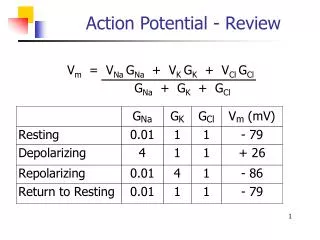
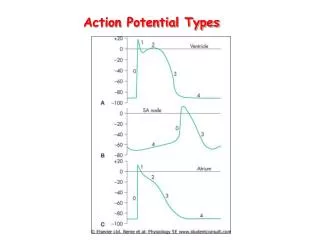
CARDIAC ACTION POTENTIAL. P X = Permeability to ion X. P Na. 1. +20. 2. P K and P Ca. 0. -20. P K and P Ca. 3. 0. -40. Membrane potential (mV). P Na. -60. -80. 4. 4. -100. 0. 100. 200. 300. Time (msec). Phase. Membrane channels. 0. Na + channels open. 1.

CARDIAC ACTION POTENTIAL
E N D
Presentation Transcript
CARDIAC ACTION POTENTIAL
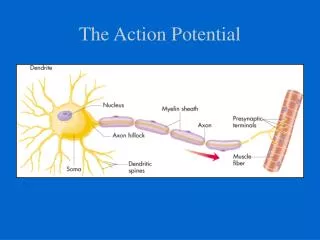
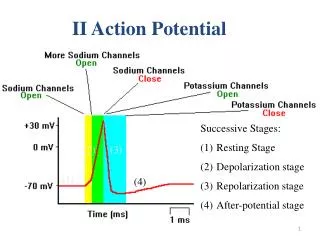
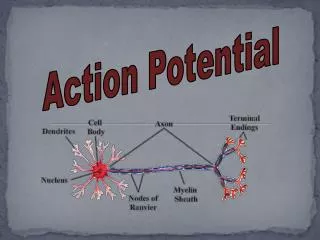
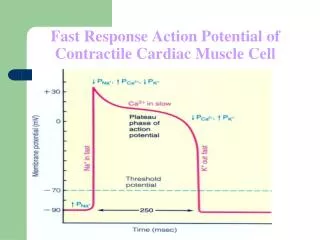
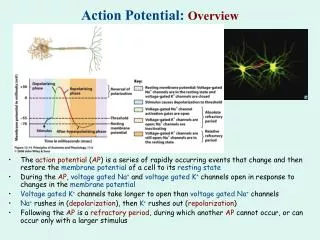
PX = Permeability to ion X PNa 1 +20 2 PK and PCa 0 -20 PK and PCa 3 0 -40 Membrane potential (mV) PNa -60 -80 4 4 -100 0 100 200 300 Time (msec) Phase Membrane channels 0 Na+ channels open 1 Na+ channels close 2 Ca2+ channels open; fast K+ channels close 3 Ca2+ channels close; slow K+ channels open 4 Resting potential Myocardial Contractile Cells The action potentials of myocardial contractile cells are similar in several ways to those of neurons and skeletal muscle. The main difference between the action potential of the myocardial contractile cell and that of a skeletal muscle fiber or a neuron is that in the myocardial cell, there is a longer action potential due to Ca2+ entry. Action potential of a cardiac contractile cell
PX = Permeability to ion X PNa 1 +20 0 -20 0 -40 Membrane potential (mV) PNa -60 -80 -100 0 100 200 300 Time (msec) Phase Membrane channels 0 Na+ channels open 1 Na+ channels close Myocardial Contractile Cells Phase 4: resting membrane potential. Myocardial contractile cells have a stable resting potential of about -90 mV. Phase 0: depolarization. When a wave of depolarization moves into a contractile cell the membrane potential becomes more positive. Voltage-gated Na+ channels open, Na+ enter the cell and rapidly depolarize it. The membrane potential reaches about +20 mV before the Na1 channels close.
PX = Permeability to ion X PNa 1 +20 2 PK and PCa 0 -20 0 -40 Membrane potential (mV) PNa -60 -80 -100 0 100 200 300 Time (msec) Phase Membrane channels 0 Na+ channels open 1 Na+ channels close 2 Ca2+ channels open; fast K+ channels close Myocardial Contractile Cells Phase 1 Initial Rapid Repolarization The opening of the voltage gated K + channels causes K + to flow out of the cell through the outward rectifier channel. This outward current starts to repolarizethe cell.The membrane potential is partially repolarized to just above zero.
PX = Permeability to ion X PNa 1 +20 2 PK and PCa 0 -20 PK and PCa 3 0 -40 Membrane potential (mV) PNa -60 -80 -100 0 100 200 300 Time (msec) Phase Membrane channels 0 Na+ channels open 1 Na+ channels close 2 Ca2+ channels open; fast K+ channels close 3 Ca2+ channels close; slow K+ channels open Myocardial Contractile Cells Phase 2: the plateau. Due to result of two events: 1)a decrease in K+ permeability and 2)an increase in Ca2t permeability. The combination of Ca2+ influx and decreased K+ efflux causes the action potential to flatten out into a plateau
PX = Permeability to ion X PNa 1 +20 2 PK and PCa 0 -20 PK and PCa 3 0 -40 Membrane potential (mV) PNa -60 -80 4 4 -100 0 100 200 300 Time (msec) Phase Membrane channels 0 Na+ channels open 1 Na+ channels close 2 Ca2+ channels open; fast K+ channels close 3 Ca2+ channels close; slow K+ channels open 4 Resting potential Phase 3: rapid repolarization. The plateau ends when Ca2+ channels close and K+ permeability increases once more. The "slow" K1 channels responsible for this phase are similar to those in the neuron. When the slow K+ channels open, K+ exits rapidly, returning the cell to its resting potential (phase 4).
The longer myocardial action potential helps prevent the sustained contraction called tetanus
Myocardial Contractile Cells Refractory periods and summation in skeletal and cardiac muscle Figure 14-14c
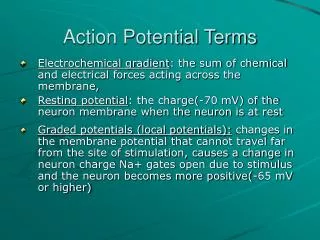
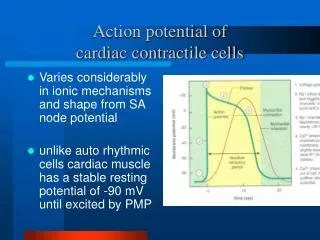
Action Potentials in Cardiac Autorhythmic Cells(ex:-SA node) Myocardial Autorhythmic Cells Generate action potentials spontaneously in the absence of input from the nervous system. This ability results from their unstable membrane potential, which starts at -60 mV and slowly drifts upward toward threshold. This unstable membrane potential is called a pacemaker potential rather than a resting membrane potential because it never "rests" at a constant value. Whenever a pacemaker potential depolarizes to threshold, the autorhythmic cell fires an action potential.
Regulation of the Heart Rate HR is controlled by the ANS: both parasympathetic (PS) and sympathetic nerves. The speed with which pacemaker cells depolarize determines the rate at which the heart contracts (the heart rate). Figure 14-16
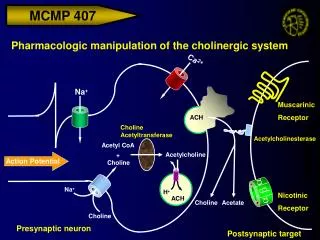
Effects of Parasympathetic activity: ↓ HR -Bradycardia PS fibres supplying the heart, are found in the right and left vagusnerves and the neurotransmitter released is acetylcholine. ACh binds to muscarinic (M2) receptors on the heart. ACh reduces the heart rate (negative chronotropic effect). Mechanism of bradycardia: ↓ rate of decay of the pacemaker potential The pacemaker potential takes longer to reach threshold and HR falls. ACh hyperpolarizes the SA node and also reduces the if and iCa currents.
Effects of sympathetic activity: ↑ HR (+ vechronotropic effect) ↑ Force of contraction (+veinotropic effect) Chronotropic Effect ↑ rate of pacemaker depolarization – threshold is reached sooner The interval between action potentials can be modified by altering the permeability of the autorhythmic cells to different ions. icrease ion flow through both If and Ca2+ channels. More rapid cation entry speeds up the rate of the pacemaker depolarization, causing the cell to reach threshold faster and increasing the rate of action potential firing .When the pacemaker fires action potentials more rapidly, heart rate increases.
Electrical Conduction in Myocardial Cells Figure 14-17
1 1 SA node AV node 2 1 THE CONDUCTING SYSTEM OF THE HEART SA node depolarizes. 2 Electrical activity goes rapidly to AV node via internodal pathways. SA node 3 Internodal pathways 3 Depolarization spreads more slowly across atria. Conduction slows through AV node. AV node 4 Depolarization moves rapidly through ventricular conducting system to the apex of the heart. A-V bundle 4 Bundle branches Purkinje fibers Depolarization wave spreads upward from the apex. 5 5 Purple shading in steps 2–5 represents depolarization. Electrical Conduction in Heart Figure 14-18
1 1 SA node AV node 1 THE CONDUCTING SYSTEM OF THE HEART SA node depolarizes. SA node Internodal pathways AV node A-V bundle Bundle branches Purkinje fibers Purple shading in steps 2–5 represents depolarization. Electrical Conduction in Heart Figure 14-18, step 1
1 1 SA node AV node 2 1 THE CONDUCTING SYSTEM OF THE HEART SA node depolarizes. 2 Electrical activity goes rapidly to AV node via internodal pathways. SA node Internodal pathways AV node A-V bundle Bundle branches Purkinje fibers Purple shading in steps 2–5 represents depolarization. Electrical Conduction in Heart Figure 14-18, steps 1–2
1 1 SA node AV node 2 1 THE CONDUCTING SYSTEM OF THE HEART SA node depolarizes. 2 Electrical activity goes rapidly to AV node via internodal pathways. SA node 3 Internodal pathways 3 Depolarization spreads more slowly across atria. Conduction slows through AV node. AV node A-V bundle Bundle branches Purkinje fibers Purple shading in steps 2–5 represents depolarization. Electrical Conduction in Heart Figure 14-18, steps 1–3
1 1 SA node AV node 2 1 THE CONDUCTING SYSTEM OF THE HEART SA node depolarizes. 2 Electrical activity goes rapidly to AV node via internodal pathways. SA node 3 Internodal pathways 3 Depolarization spreads more slowly across atria. Conduction slows through AV node. AV node Depolarization moves rapidly through ventricular conducting system to the apex of the heart. 4 A-V bundle 4 Bundle branches Purkinje fibers Purple shading in steps 2–5 represents depolarization. Electrical Conduction in Heart Figure 14-18, steps 1–4
1 1 SA node AV node 2 1 THE CONDUCTING SYSTEM OF THE HEART SA node depolarizes. 2 Electrical activity goes rapidly to AV node via internodal pathways. SA node 3 Internodal pathways 3 Depolarization spreads more slowly across atria. Conduction slows through AV node. AV node 4 Depolarization moves rapidly through ventricular conducting system to the apex of the heart. A-V bundle 4 Bundle branches Purkinje fibers Depolarization wave spreads upward from the apex. 5 5 Purple shading in steps 2–5 represents depolarization. Electrical Conduction in Heart Figure 14-18, steps 1–5
Electrical Conduction • AV node • Direction of electrical signals • Delay the transmission of action potentials • SA node • Set the pace of the heartbeat at 70 bpm • AV node (50 bpm) and Purkinje fibers (25-40 bpm) can act as pacemakers under some conditions