Download
1 / 55
780 likes | 2.37k Vues
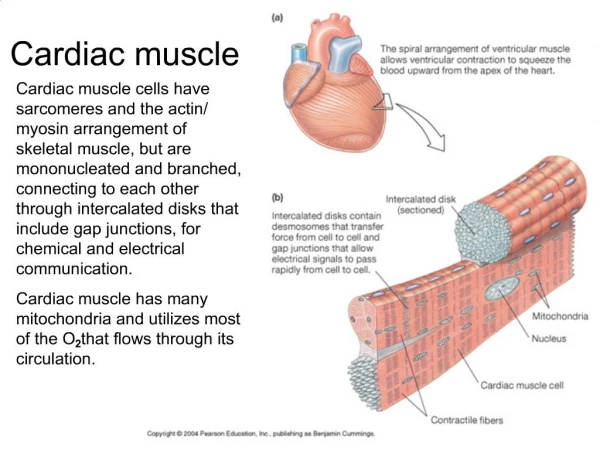
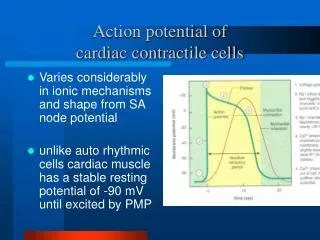
Fast Response Action Potential of Contractile Cardiac Muscle Cell. Pacemaker and Action Potentials of the Heart. Slow Response Action Potential (Pacemaker Potential). Intrinsic rate and speed of conduction of the components of the system. SA node 60-80 action potential /min ( Pacemaker )

E N D
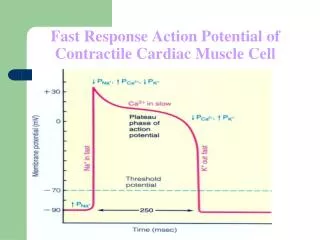
Fast Response Action Potential of Contractile Cardiac Muscle Cell
Intrinsic rate and speed of conduction of the components of the system • SA node 60-80 action potential /min (Pacemaker) • AV node 40-60 action potential /min • Purkinje 15-40 action potential /min Conduction Speed • SA node: slow speed of conduction • Ventricular and Atrial muscle: Moderate speed • AV node: slowest speed of conduction • Purkinje fibers: Fastest speed of conduction • Ectopic Pacemaker- Abnormal site of pacemaker
Extrinsic Innervation of the Heart Vital centers of medulla 1. Cardiac Center Cardioaccelerator center Activates sympathetic neurons that increase HR Cardioinhibitory center Activates parasympathetic neurons that decrease HR Cardiac center receives input from higher centers (hypotha-lamus), monitoring blood pressure and dissolved gas concentrations
Sympathetic – increases heart rate by Ca+2 & If channel (net Na+) flow Parasympathetic – decreases rate by K+ efflux & Ca+2 influx Autonomic neurotransmitters affect ion flow to change rate What part of the graph is not changed by autonomic influences?
Effect of Sympathetic & Parasympathetic Stimulation Effect of Sympathetic & Parasympathetic Stimulation Sympathetic Sympathetic Parasympathetic Parasympathetic 0 0 3 3 4 4
Regulation of the heart beat • Sympathetic from the cardiac plexus supplies all parts of the heart (atria, ventricle and all parts of the conduction system) • Parasympathetic from Vagus nerves supply mainly the atria, SA and AV nodes, very little supply to ventricles • Sympathetic: increase the permeability of the cardiac cells to Na+ and Ca++ i.e Positive Chronotropic and positive Inotropic action • Parasympathetic: Increase the permeability of the cardiac cells to K+ and decrease its permeability to Na+ and Ca++ • Ventricular Escape and Overdrive suppression-
Time of Arrival of Cardiac Impulse (0.22) SA Node AV Bundle (0.19) H (0.0) T (0.03) (0.12) Left Bundle Branch (0.16) (0.19) (0.18) AV Node Right Bundle Branch (0.21) (0.17) Main Arrival Times S-A Node 0.00 sec A-V Node 0.03 sec A-V Bundle 0.12 sec Ventricular Septum 0.16 sec (0.18)
Sinus Node is Cardiac Pacemaker • Normal rate of discharge in sinus node is 70-80/min.; A-V node - 40-60/min.; Purkinje fibers - 15-40/min. • Sinus node is pacemaker because of its faster discharge rate • Intrinsic rate of subsequent parts is suppressed by “Overdrive suppression”
Ectopic Pacemaker • This is a portion of the heart with a more rapid discharge than the sinus node. • Also occurs when transmission from sinus node to A-V node is blocked (A-V block).
Ectopic Pacemaker (cont’d) • During sudden onset of A-V block, sinus node discharge does not get through, and next fastest area of discharge becomes pacemaker of heart beat (Purkinje system). • Delay in pickup of the heart beat is the “Stokes-Adams” syndrome. New pacemaker is in A-V node or penetrating part of A-V bundle.
Parasympathetic Effects on Heart Rate • Parasympathetic (vagal) nerves, which release acetylcholine at their endings, innervate S-A node and A-V junctional fibers proximal to A-V node. • Causes hyperpolarization because of increased K+ permeability in response to acetylcholine. • This causes decreased transmission of impulses maybe temporarily stopping heart rate. • Ventricular escape occurs.
Sympathetic Effects on Heart Rate • Releases norepinephrine at sympathetic ending • Causes increased sinus node discharge (Chronotropic effect) • Increases rate of conduction of impulse (Dromotropic effect) • Increases force of contraction in atria and ventricles (Inotropic effect)
Electrocardiography – Normal5 Faisal I. Mohammed, MD, PhD
Objectives • Describe the different “waves” in a normal electrocardiogram. • Recall the normal P-R and Q-T interval time of the QRS wave. • Distinguish the difference in depolarization and repolarization waves. • Recognize the voltage and time calibration of an electrocardiogram chart. • Point out the arrangement of electrodes in the bipolar limb leads, chest leads, and unipolar leads. • Describe Einthoven’s law.
Depolarization and Repolarization Waves • Note that no potential is recorded when the ventricular muscle is either completely depolarized or repolarized.
R P T Q S Normal EKG Q-T interval 0.35 sec P-R interval 0.16 sec R P T Q Ventricular repolarization Atrial depolarization S Ventricular depolarization
SINGLE VENTRICULAR ACTION POTENTIAL ENDOCARDIAL FIBER ATRIAL FIBER EPICARDIAL FIBER R 1 mV ECG T P Repolarization of ventricles Q S Depolarization of ventricles Depolarization of atria
Standardized EKG’s • Time and voltage calibrations are standardized
Electrocardiogram Record of electrical events in the myocardium that can be correlated with mechanical events P wave: depolarization of atrial myocardium. Signals onset of atrial contraction QRS complex: ventricular depolarization Signals onset of ventricular contraction.. T wave: repolarization of ventricles PR interval or PQ interval: 0.16 sec Extends from start of atrial depolarization to start of ventricular depolarization (QRS complex) contract and begin to relax Can indicate damage to conducting pathway or AV node if greater than 0.20 sec (200 msec) Q-T interval: time required for ventricles to undergo a single cycle of depolarization and repolarization Can be lengthened by electrolyte disturbances, conduction problems, coronary ischemia, myocardial damage
Depolarization and Repolarization Waves • Note that no potential is recorded when the ventricular muscle is either completely depolarized or repolarized.
+ + + + + + + + + + + + + + + + + + + + + + + + + + + + + + + + + + + + + + + + + + + + + + + + + + + + + + + + + + + + + + + + Flow of Electrical Currents in the Chest Around the Heart Mean Vector Through the Partially Depolarized Heart _ _ _ _ _ _ _ _ _ _ _ _ _ _ _ _ _ _ _ _ _ _ _ _ _ _ _ _ _ _ _ _ _ _ _ _ _ _ _
Flow of Electrical Currents in the Chest Around the Heart (cont’d) • Ventricular depolarization starts at the ventricular septum and the endocardial surfaces of the heart. • The average current flows positively from the base of the heart to the apex. • At the very end of depolarization the current reverses from 1/100 second and flows toward the outer walls of the ventricles near the base (S wave).
EKG Concepts • The P wave immediately precedes atrial contraction. • The QRS complex immediately precedes ventricular contraction. • The ventricles remain contracted until a few milliseconds after the end of the T repolarization wave. • The atria remain contracted until the atria are repolarized, but an atrial repolarization wave cannot be seen on the electrocardiogram because it is masked by the QRS wave.
EKG Concepts (cont’d) • The P-Q or P-R interval on the electrocardiogram has a normal value of 0.16 seconds and is the duration of time between the beginning of the P wave and the beginning of the QRS wave; this represents the time between the beginning of atrial contraction and the beginning of ventricular contraction.
EKG Concepts (cont’d) • The Q-T interval has a normal value of 0.35 seconds and is the duration of time from the beginning of the Q wave to the end of the T wave; this approximates the time of ventricular contraction. • The heart rate can be determined with the reciprocal of the time interval between each heartbeat.
Bipolar Limb Leads • Bipolar means that the EKG is recorded from two electrodes on the body.
Bipolar Limb Leads (cont’d) • Lead I - The negative terminal of the electrocardiogram is connected to the right arm, and the positive terminal is connected to the left arm. • Lead II - The negative terminal of the electrocardiogram is connected to the right arm, and the positive terminal is connected to the left leg.
Bipolar Limb Leads (cont’d) • Lead III - The negative terminal of the electrocardiogram is connected to the left arm, and the positive terminal is connected to the left leg. • Einthoven’s Law states that the electrical potential of any limb equals the sum of the other two (+ and - signs of leads must be observed). L II= L I + L III • If lead I = 1.0 mV, Lead III = 0.5 mV, then Lead II = 1.0 + 0.5 = 1.5 mV • Kirchoff’s second law of electrical circuits • LI+LII+LIII=0
ECG Recordings (QRS Vector pointing leftward, inferiorly & anteriorly) 3 Bipolar Limb Leads: RA LA I = RA vs. LA (+) LL
ECG Recordings (QRS Vector pointing leftward, inferiorly & anteriorly) 3 Bipolar Limb Leads: RA LA I = RA vs. LA (+) II = RA vs. LL (+) LL
ECG Recordings (QRS Vector pointing leftward, inferiorly & anteriorly) 3 Bipolar Limb Leads: RA LA I = RA vs. LA (+) II = RA vs. LL (+) III = LA vs. LL (+) LL
Bipolar Limb Leads (cont’d) 0.5 mV 1.2 mV 0.7 mV
Einthoven’s triangle and law + + +
Other EKG Leads (cont’d) • Augmented Unipolar Limb Leads aVR, aVL, and aVF are also in use. For aVR the + electrode is the right arm, and the - electrode is the left arm + left leg; aVL + electrode is left arm; aVF + electrode is left foot and the negative electrode is the other two limbs
Unipolar Limb Leads
ECG Recordings (QRS Vector pointing leftward, inferiorly & anteriorly) 3 Bipolar Limb Leads: RA LA I = RA vs. LA (+) II = RA vs. LL (+) III = LA vs. LL (+) 3 Augmented Limb Leads: LL aVR = (LA-LL) vs. RA(+)
ECG Recordings (QRS Vector pointing leftward, inferiorly & anteriorly) 3 Bipolar Limb Leads: RA LA I = RA vs. LA (+) II = RA vs. LL (+) III = LA vs. LL (+) 3 Augmented Limb Leads: LL aVR = (LA-LL) vs. RA(+) aVL = (RA-LL) vs. LA(+)
ECG Recordings (QRS Vector pointing leftward, inferiorly & anteriorly) 3 Bipolar Limb Leads: RA LA I = RA vs. LA (+) II = RA vs. LL (+) III = LA vs. LL (+) 3 Augmented Limb Leads: LL aVR = (LA-LL) vs. RA(+) aVL = (RA-LL) vs. LA(+) aVF = (RA-LA) vs. LL(+)
Other EKG Leads • Chest Leads (Precordial Leads) known as V1-V6 are very sensitive to electrical potential changes underneath the electrode.
6 PRECORDIAL (CHEST) LEADS Spine V6 V5 Sternum V4 V3 V1 V2