Final Project
This project explores the implementation of image retrieval techniques using INRIA Holiday and Kentucky Benchmark datasets. The goal is to classify landmark images and evaluate performance through metrics like Mean Average Precision (mAP), precision, and recall. Key components include duplicating retrieval tasks on benchmark datasets, employing techniques such as nearest neighbors and support vector machines, and identifying optimal design choices. The project requires active participation, a midterm report, and in-class discussions to achieve a comprehensive understanding of state-of-the-art methods.


Final Project
E N D
Presentation Transcript
Final Project Mei-Chen Yeh May 15, 2012
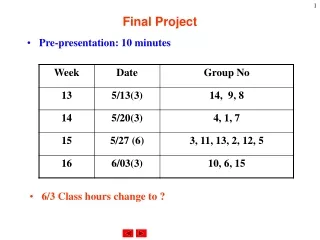
General • In-class presentation • June 12 and June 19, 2012 • 15 minutes, in English • 30% of the overall grade • In-class individual discussion on May 22 • Original plan: • Participation 10% • Midterm report 20% • Projects and presentations 50% • project 1: 20% • final project: 30% • Assignments 20% • New plan: • Participation 10% • Midterm report 25% • Projects and presentations 55% • project 1: 25% • final project 30% • Assignments 10%
Tasks • Your own proposal: implement parts of your ideas in the midterm report • Duplicate the image retrieval task on the public benchmarks • INRIA Holidays • Kentucky Benchmark (UKB) • Landmark classification
Image Search: INRIA Holiday • 1,491 images of 500 scenes • One image per scene is used as query to search within the remaining 1,490 images; 500 queries in total, and 991 corresponding relevant images • Evaluation: • the mean Average Precision (mAP) over the 500 queries
Evaluation Measurement |Ra|/|R| • Recall • The fraction of the relevant images which have been retrieved • Precision • The fraction of the retrieved images which are relevant |Ra|/|A| All images |Ra| Relevant |R| Retrieved |A|
Example • 10 relevant images. 15 retrieved images • Ranking of the images for a given query q • {d123, d84,d56, d6, d8,d9, d511, d129, d187,d25, d38, d48, d250, d113,d3} precision = 50% recall = 30% precision = 40% recall = 40% precision = 67% recall = 20% precision = 100% recall = 10% Slide credit: Prof. Berlin Chen
Average Precision (AP) • Average the precisions obtained when a relevant image is retrieved
Mean Average Precision (MAP) • Find the average precision for each query • Compute the mean AP over all queries • State-of-the-art* on INRIA: 0.79 *Gorda et al., Leveraging Category-Level Labels For Instance-Level Image Retrieval, CVPR 2012.
INRIA Holiday • Dataset description • the images themselves • a set of descriptors extracted from these images • a set of descriptors produced, with the same extractor and descriptor, for a distinct dataset (Flickr60K) • two sets of clusters used to quantize the descriptors. These have been obtained from Flickr60K.
Kentucky Benchmark • 10,200 images of 2,550 objects, all the images are 640x480. • Each image is used in turn as query to search within the 10,200 images • Evaluation • 4xreall@4 averaged over the 10,200 queries • how many of the top-4 returned images are correct • the maximum achievable score is 4 • State-of-the-art*: 3.36 *Gorda et al., Leveraging Category-Level Labels For Instance-Level Image Retrieval, CVPR 2012.
Landmark Classification • Label instances, usually represented by feature vectors, into one of the predefined categories (67 scenes/objects in our case). • Evaluation: 4-fold cross validation Yeileu
K-fold cross validation • Partition the original sample into K subsamples. • Of the K subsamples, a single subsample is used for testing, and the remaining K − 1 subsamples are used for training. • Repeated K times (the folds), with each of the K subsamples used exactly once as the testing data. • The K results from the folds then can be averaged to produce the classification rate.
K-fold cross validation …… • Validation • Validation • Validation K
Our case: 4-fold 001.jpg 002.jpg 003.jpg 004.jpg 005.jpg 006.jpg 007.jpg 008.jpg Yeileu
Landmark classification: Approach • Nearest neighbor • Support vector machines • Linear • Non-linear (kernel) • … Analyze and compare the performances of various design choices
Tasks • Your own proposal: implement parts of your ideas in the midterm report • Duplicate the image retrieval task on the public benchmarks • INRIA Holidays • Kentucky Benchmark (UKB) • Landmark classification
Make a work plan now! • Start early • No cheating • Deliver a working system In-class individual discussion on May 22