Download
1 / 29
290 likes | 421 Vues
This overview covers essential statistical concepts including measures of variability, statistical jargon related to population parameters and sample statistics, and sampling methods. It details different approaches such as Simple Random Sampling, Stratified Sampling, and Cluster Sampling, discussing their advantages and disadvantages. Also explored are the implications of biased samples and the importance of using representative data for accurate inference. The material utilizes examples, such as the faulty Literary Digest poll, to illustrate the impact of bias on statistical results.

E N D
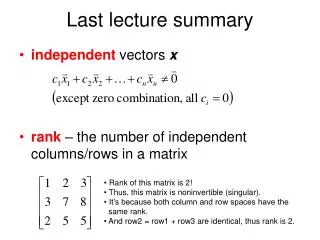
Last lecture summary • Which measures of variability do you know? • What are they advantages and disadvantages? • Empirical rule
Statistical jargon population (census) vs. sample parameter (population) vs. statistic (sample) Population - parameter Mean Standard deviation Sample - statistic Mean Standard deviation Výběr - statistika Výběrový průměr Výběrová směrodatná odchylka
Statistical inference • A statistic is a value calculated from our observed data (sample). • A parameter is a value that describes the population. • We want to be able to generalize what we observe in our data to our population. In order to this, the sample needs to be representative. • How to select a representative sample? Use randomization.
Random sampling • Simple Random Sampling (SRS) – each possible sample from the population is equally likely to be selected. • Stratified Sampling – simple random sample from subgroups of the population • subgroups: gender, age groups, … • Cluster sampling – divide the population into non-overlapping groups (clusters), sample is a randomly chosen cluster • example: population are all students in an area, randomly select schools and create a sample from students of the given school
Simple random sampling • sampling with replacement (WR) • výběr s navrácením • Generates independent samples • Two sample values are independent if that what we get on the first one doesn't affect what we get on the second. • sampling without replacement (WOR) • výběr bez navrácení • Deliberately avoid choosing any member of the population more than once. • This type of sampling is not independent, however it is more common. • The error is small as long as • the sample is large • the sample size is no more than 10% of population size
Bias • If a sample is not representative, it can introduce bias into our results. • bias – zkreslení, odchylka • A sample is biased if it differs from the population in a systematic way. • The Literary Digest poll, 1936, U. S. presidential election • surveyed 10 mil. people – subscribers • 2.3 mil. responded predicting (3:2) a Republican candidate to win • a Democrat candidate won • What went wrong? • only wealthy people were surveyed (selection bias) • survey was voluntary response (nonresponse bias) – angry people or people who want a change
Bessel’s correction www.udacity.com – Statistics
Sample vs. population SD • We use sample standard deviation to approximate population paramater • But don’t get confused with the actual standard deviation of a small dataset. • For example, let’s have this dataset: 5 2 1 0 7. Do you divide by or by ?
Bessel's game • An important property of a sample statistic that estimates a population parameter is that if you evaluate the sample statistic for every possible sample and average them all, the average of the sample statistic should equal to the population parameter. We want: • This is called unbiased.
Bessel’s game • List all possible samples of 2 cards. • Calculate sample averages. Population of all cards in a bag
Bessel’s game • List all possible samples of 2 cards. • Calculate sample averages. • Now, half of you calculate sample variance using /n, and half of you using /(n-1). • And then average all sample variances. Population of all cards in a bag
Median absolute deviation (MAD) • standard deviation is not robust • IQR is robust • mean absolute deviation MAD – a robust equivalent of the standard deviation • Také your data, find median, calculate absolute deviation from the median, find the median of absolutes deviations
Median absolute deviation (MAD) Median: MAD:
Playing chess • Pretend I am a chess player. • Which of the following tells you most about how good I am: • My rating is 1800. • 8110th place among world competitive chess players. • Ranked higher than 88% of competitive chess players.
Distribution Distribution of scores in one particular year We should use relative frequencies and convert all absolute frequencies to proportions.
Height data – absolute frequencies http://wiki.stat.ucla.edu/socr/index.php/SOCR_Data_Dinov_020108_HeightsWeights
Height data – relative frequencies What proportion of values is between 170 cm and 173.75 cm? 30%
Height data – relative frequencies What proportion of values is between 170 cm and 175 cm? We can’t tell for certain.
How should we modify data/histogram to allow us a more detail? • Adding more value to the dataset • Increasing the bin size • A smaller bin size
Height data – relative frequencies What proportion of values is between 170 cm and 175 cm? 36%
Normal distribution recall the empirical rule 68-95-99.7