Last lecture summary
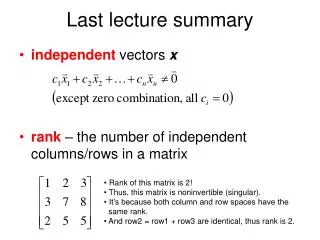
Last lecture summary. Five numbers summary, percentiles, mean Box plot, modified box plot Robust statistic – mean, median, trimmed mean outlier Measures of variability range, IQR. measures of VARIABILITY. Problem with IQR. normal. bimodal. uniform. Options for measuring variability.

Last lecture summary
E N D
Presentation Transcript
Last lecture summary • Five numbers summary, percentiles, mean • Box plot, modified box plot • Robust statistic – mean, median, trimmed mean • outlier • Measures of variability • range, IQR
Problem with IQR normal bimodal uniform
Options for measuring variability • Find the average distance between all pairs of data values. • Find the average distance between each data value and either the max or the min. • Find the average distance between each data value and the mean.
Preventing cancellation • How can we prevent the negative and positive deviations from cancelling each out? • Take absolute value of each deviation. • Square each deviation.
Average absolute deviation avg. absolute deviation = 4.6
Average absolute deviation What formulas describes what you just did?
Squared deviations SS, sum of squares (čtverce odchylek) avg. square deviation = 31.2
Variance Average squared devation has a special name – variance (rozptyl).
Standard deviation • směrodatná odchylka, • Which symbol would you use for a variance?
Standard deviation • What is so great about the standard deviation? Why don’t we just find the average absolute deviation? Empirical rule 68% - 1 s.d. 95% - 2 s.d. 99.7% - 3 s.d. More on absolute vs. standard deviation: http://www.leeds.ac.uk/educol/documents/00003759.htm
Empirical rule , ? It covers 273 data values, 66.8%. covers 380 data values, 95%. covers 397 data values, 99.3%.
Empirical rule 197 countries 65% within 1 s.d. 94.7 within 2 s.d. 100% within 3 s.d.
Statistical inference • The goal of statistical work: make rational conclusions or decisions based on the incomplete information we have in our data. • This process is known as statistical inference. • In inferential statistics we want to be able to answer the question: “If I see something in my data, say a difference between two groups or a relationship between two variables, could this be simply due to chance? Or is it a real difference in relationship?”
Statistical inference • If we get results that we think are not just due to chance we'd like to know what broader conclusions we can make. Can we generalize them to a larger group or even perhaps the whole world? • And when we see a relationship between two variables, we'd like to know if one variable causes the other to change. • The methods we use to do so and the correctness of the conclusions that we can make all depend on how the data were collected.
Statistical inference • fundamental feature of data: variability • How can we picture this variation and how can we quantify it? • Population – the group we are interested in making conclusions about. • Census – a collection of data on the entire population. • Sample – if we can’t conduct a census, we collect data from the sample of a population. Goal: make conclusions about that population.
Statistical inference • A statistic is a value calculated from our observed data (sample). • A parameter is a value that describes the population. • We want to be able to generalize what we observe in our data to our population. In order to this, the sample needs to be representative. • How to select a representative sample? Use randomization.
population (census) vs. sample parameter (population) vs. statistic (sample) Population - parameter Mean Standard deviation Sample - statistic Mean Standard deviation Výběr - statistika Výběrový průměr Výběrová směrodatná odchylka
Random sampling • Simple Random Sampling (SRS) – each possible sample from the population is equally likely to be selected. • Stratified Sampling – simple random sample from subgroups of the population • subgroups: gender, age groups, … • Cluster sampling – divide the population into non-overlapping groups (clusters), sample is a randomly chosen cluster • example: population are all students in an area, randomly select schools and create a sample from students of the given school
Bias • If a sample is not representative, it can introduce bias into our results. • bias – zkreslení, odchylka • A sample is biased if it differs from the population in a systematic way. • The Literary Digest poll, 1936, U. S. presidential election • surveyed 10 mil. people – subscribers or owned cars or telephones • 2.3 mil. responded predicting (3:2) a Republican candidate to win • a Democrat candidate won • What went wrong? • only wealthy people were surveyed (selection bias) • survey was voluntary response (nonresponse bias) – angry people or people who want a change
Sample vs. population SD • We use sample standard deviation to approximate population paramater • But don’t get confused with the actual standard deviation of a small dataset. • For example, let’s have this dataset: 5 2 1 0 7. Do you divide by or by ?
Suppose you have a bag with 3 cards in it. The cards are numbered 0, 2 and 4. • What is the population mean? And the population variance? • An important property of a sample statistic that estimates a population parameter is that if you evaluate the sample statistic for every possible sample and average them all, the average of the sample statistic should equal the population parameter. We want: • This is called unbiased.
SRS • sampling with replacement • Generates independent samples • Two sample values are independent if that what we get on the first one doesn't affect what we get on the second. • sampling without replacement • Deliberately avoid choosing any member of the population more than once. • This type of sampling is not independent, however it is more common. • The error is small as long as • the sample is large • the sample size is no more than 10% of population size
Bessel’s game • Now list all possible samples of 2 cards. • Calculate sample averages. • Now, half of you calculate sample variance using /n, and half of you using /(n-1). • And then average all sample variances. 0 2 4 Population of all cards in a bag
Measuring spread – summary • median = $112 000 • mean = $518 000 • trimmed median = $112 000 • trimmed mean = $128 000