Download
1 / 52
540 likes | 976 Vues
Monday TEK 12C: Analyze the flow of matter and energy through trophic levels using various models including food chains , food webs, and ecological pyramids Lesson frame : We will analyze the flow of energy and matter through a food chain.

E N D
Monday • TEK 12C: Analyze the flow of matter and energy through trophic levels • using various models including food chains, food webs, and ecological pyramids • Lesson frame: • We will analyze the flow of energy and matter through a food chain. • I will complete the Looney Labels Food Chain activity • I will be able to correctly answer a food chain question to show understanding.
What is the main source of Energy w/in an Ecosystem? The SUN! It provides Energy for the plants so that they can undergo photosynthesis and grow and then animals eat them.
Aut trophs “Auto” = self “troph” = food They are PRODUCERS! Organisms that use Energy from the environment to make their own food! (e.g.; plants and some bacteria)
Heterotroph “Hetero” = other “troph” = food They are CONSUMERS! Organisms that eat Other organisms to Obtain Energy. (e.g.; mushrooms, leopards, humans, & sharks)
Herbivores Animals that eat ONLY plants, fruits, and “herbs” (e.g.; Fruit Bats, Moose, Elephants, Rabbits, Deer, Cows)
Omnivores Animals that eat both autotrophs & heterotrophs (plants and animals) (e.g.; bears, most humans, pigs, dogs, monkeys, ducks & crows)
Carnivores Animals that eat other heterotrophs (animals)… Meat Eaters ONLY! (e.g.; Komodo Dragons, Lions, Tigers, Snakes & Octopus)
Predator vs. Prey Predator Captures and feeds Prey Is eaten or fed on
Decomposers Breaks down organic matter and recycles it back into the earth (this makes them the ultimate top level consumer) (e.g.; fungi/ mushrooms, and bacteria) Decomposers
Detritivores Scavengers; Feed on DEAD decaying organisms (e.g.; mites, flies, earthworms, snails, crabs, rats & vultures) Detritivores
Teacher: Model the LOONEY LABEL activity Student: work on activity until teacher calls a huddle
Huddle up! Did we get it? Answer the following questions
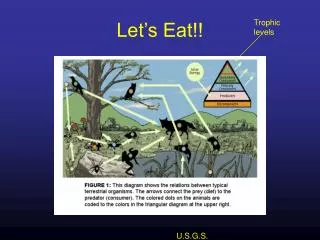
Food Chain Shows how Energy is transferred “thru” an Ecosystem Sun Autotrophs Heterotrophs Shows a linear feeding relationship for 1 particular organism(“Who eats who”) Arrows ALWAYS Point to the 1 who is Enjoying the Meal Some People
Take it away Tuesday • TEK 12C: Analyze the flow of matter and energy through trophic levels • using various models including food chains, food webs, and ecological pyramids • Lesson frame: • I can analyze the flow of energy from one trophic level to another • I can explain the flow of energy and the 10% rule within food chains/webs/pyramids.
Food Web Shows a NETWORK of interconnected feeding relationships within an ecosystem Food Webs are ALL of the Food Chains w/in an Ecosystem linked together (“Who eats who” and “whose being eaten”)
Trophic Levels Each step in a food chain or food web PRODUCERS REPRESENTS THE 1ST LEVEL CONSUMERS MAKE UP THE 2ND, 3RD, OR HIGHER LEVELS Each consumer depends on the trophic level below it for energy
Trophic Levels w/in A Food Web Producers Always start a food chain or a food web; plants or bacteria Primary Consumers eat the producers; herbivores
Trophic Levels w/in A Food Web Secondary Consumers Eat the producers and the primary consumers; omnivores Tertiary Consumers Eat the secondary and primary consumers; carnivores = the top Predator
Only 10 percent of the enerey stored in an organism can be passed on to the next trophic level. Of the remaining energy, some is used for the organism’s life processes, and the rest is • Used in reproduction • Stored as body fat • Stored as body tissue • Eliminated as heat
What is the function of bacteria in the food web? • Decomposer • Producer • Primary consumer • Secondary consumer
What to do Wednesday • TEK 12C: Analyze the flow of matter and energy through trophic levels using various models including food chains, food webs, and ecological pyramids • And • 11C: Summarize the role of microorganisms in both maintaining and disrupting the health of both organisms and ecosystems • Lesson frame: • I can analyze all 3 pyramids( energy/mass/numbers) • I can explain the flow of energy and the 10% rule within food chains/webs/pyramids. • I can analyze the flow of energy from one trophic level to another • I can explain how bacteria can help or harm both organisms and ecosytems
The Effects of Toxins in the Food Chain http://www.youtube.com/watch?v=E5P-UoKLxlA
Biomass Pyramids Biomass total amount of living tissue within a given trophic level The Pyramid represents the potential food available for each trophic level.
Pyramids of Numbers Based on the # of organisms at each trophic level. There should always be more producers represented than there are consumers http://www.vtaide.com/png/foodchains-mcq.htm
Energy Pyramids/ The Rule of 10 Only about 10% of the ENERGY available w/in 1 Trophic Level is transferred to organisms at the trophic level above it The rest of the Energy is released in some form of heat (e.g.; when you eat a chicken wing you are only going to absorb 10% of it’s energy)
Usable energy available at each trophic level (in kilocalories) Heat Tertiary consumers (human) 10 Heat Secondary consumers (perch) 100 Heat Decomposers Heat Primary consumers (zooplankton) 1,000 Heat 10,000 Producers (phytoplankton) Fig. 3-15, p. 63
How do microorganisms maintain the health of ecosystems? • Some microorganisms are decomposers that break down organic matter into smaller pieces, eventually releasing raw nutrients back to the ecosystem. • Some bacteria convert nitrogen and other nutrients to forms that can be used by primary producers (plants and other photosynthetic organisms). • Specialized “oil-eating” bacteria help restore ecosystems following oil spills. • Mycorrhizal fungi seem to help ecosystems recover following disturbances. http://www.youtube.com/watch?v=WLk-9ib0OVA
How do microorganisms disrupt the health of ecosystems? • Populations of some usually harmless aquatic microorganisms, including dinoflagellates and the photosynthetic protistEuglena (seen here), can grow exponentially following an influx of nutrients. Such responses to added nutrients are called algal blooms, andthey can be very harmful to ecosystems. • Algal blooms can block sunlight and disrupt photosynthesis. • Blooms of dinoflagellates, called red tides,release toxins into the ecosystem. • Increased rates of decomposition following very large blooms can result in dead zones, areas devoid of oxygen that are inhospitable to multicellular life.
Why couldn‘tyou survive a day without bacteria? • They process our wastes and make them usable again. Without them – nothing would rot. • They purify our water. • Keep our soils productive • Synthesize vitamins in our intestines • Convert our food into useful sugars and polysaccharides • Wage war on alien microbes that enter our digestive system • Pluck nitrogen from the air and convert it into useful nucleotides and amino acids for us.
In general, which trophic level has the most energy available to it? • Primary consumers • Producer • Secondary consumer • Tertiary consumer
The diagram is intended to show relationships in an ecosystem. What do the arrows represent?
Lactose is a naturally occurring sugar found in milk. Some dairy products, such as yogurt, may contain live bacteria. These products are useful to people who lack the ability to digest lactose. What does this information demonstrate? Bacteria raise the acidity of processed foods. Some bacteria interfere with digestion. Bacteria can prevent insulin production. Some bacteria are beneficial to human health.
Thursday we EAT/ DRINK/ AND BE MERRY- During the BEAR LAB
12 D: Recognize that long term survival of species is dependent on changing resource basis that are limited. (Students can recognize the effects of limited resources in an environment.) Limiting Factors • Lesson frame: • We will recognize the effects of limited resources in an environment. • I will compete for food and water during the bear activity. • I will be able to correctly answer a limiting factor question to show understanding.
Stem Questions: • Suppose you could eat up to 12 times your body weight every day like a hummingbird what would you do maintain your food supply? • Can you predict the outcome if fertilizers were banned? • Can you assess the value of human disturbance within an ecosystem? • What choice would you have made if food was unlimited? • How would you prioritize the effect of a decomposer in replacing limiting factors back into the ecosystem? • What would result if the amount of expected annual rainfall in a desert were to decrease in half? • How would you organize limiting factors to show the difference between biotic and abiotic factors?
Reasons WHY we Compete to Survive… To Obtain: Food Living Space Other Needs in Life
“Competition” Competitive Exclusion Principle Says that in nature: Direct competition often results in a “WINNER” and a “LOSER,” w/ the losing organism failing to survive
What do we know about Populations? All populations will GROW to their CarryingCapacity as long as there is enough food, shelter, & other necessities needed for life!
Carrying Capacity the largest # of individuals that an environment can support… The # right before there is not enough food & space to go around, and individuals will start to die off.
What else would cause a Population to decrease? Such as natural disasters, human disturbances, disease, and predation
Limiting Factor A factor that causes the growth of a population to decrease. Examples 1.Space 2. Water 3. Food 4.Nutrients
Pre Lab Questions What is the relationship between competition and population size? Identify how a limited resource can affect the size of a population. Give an example that illustrates this situation.
Follow the instructions for the Bear lab Regroup later with your teacher to answer some questions and wrap up
An example of an abiotic limiting factor affecting aquatic organisms it the
Any abiotic or biotic factor that controls the number of individual in a population is a. A pollutant b. Chemosynthesis c. A bioaccumulation indicator d. A limiting factor