Download
1 / 20
210 likes | 499 Vues
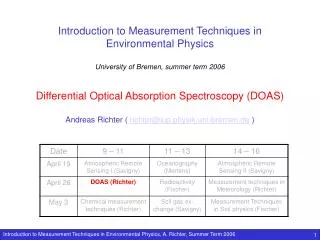
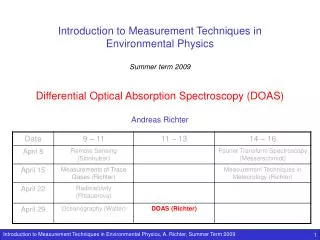
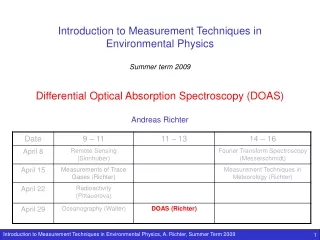
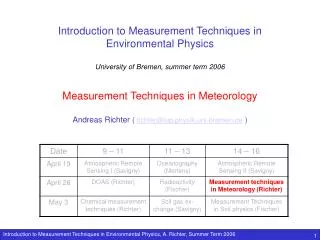
Introduction to Measurement Techniques in Environmental Physics University of Bremen, summer term 2006 Measurement Techniques in Meteorology Andreas Richter ( richter@iup.physik.uni-bremen.de ). Overview . basic measurement quantities in meteorology

E N D
Introduction to Measurement Techniques in Environmental Physics University of Bremen, summer term 2006 Measurement Techniques in Meteorology Andreas Richter (richter@iup.physik.uni-bremen.de)
Overview • basic measurement quantities in meteorology • different instruments used to take the measurements • physical principles behind the measurements • some problems related to the measurements • outlook to satellite meteorology
Which quantities do we need to measure? • air temperature • wind speed and direction • pressure • humidity • visibility • cloud distribution • cloud type • type and amount of precipitation How do we want to measure them? • in as many places as possible • as continuously as possible • as reproducible as possible • => we need cheap, simple, and automated measurements
Measurements of air temperature I • liquid filled / metallic thermometers • effect: T-dependence of volume • use: volume change ΔV = V0(α1- α2) ΔT • Δl = ΔV / A • where A = area of tube • α1 = coefficient of expansion of liquid • α2 = coefficient of expansion of reservoir • resistance thermometer • effect: T-dependence of electrical resistance of platinum or nickel(e.g.: Pt100 with 100 Ω at 0 °C ) • use: R = R20 (1 + α · ΔT) • T = 20 °C + (R/R20-1) / α • the temperature coefficient α is constant in first approximation but tabulated for higher accuracy • thermistor thermometer • effect: (negative) T-dependence of semiconductor resistance
Measurements of air temperature II • energy budget of thermometer • sensible heat transfer • radiative heat transfer: • short wave (gain) • long wave (loss or gain, depending on surroundings) • (latent heat transfer if wet) • => generally overestimation of T during the day • => underestimation of T during night • => underestimation of T if wet • response time of thermometer • finite time lag between temperature change and change in measured value • depends on thermal mass of thermometer • depends strongly on wind speed
Reminder: water vapour in the atmosphere The amount of water in a given air volume is crucial for its ability to transfer energy. Common moisture parameters are: mass mixing ratio: where mv is the mass of water vapour and md the mass of dry air saturation vapour pressure:the vapour pressure that is reached in equilibrium above a plane surface of pure water es or over ice esi. Note that es and esi depend only on temperature and that es > esi at all temperatures. relative humidity: dew point: Temperature at which water vapour in a given air volume would start to condensate frost point: Temperature at which water vapour in a given volume would start to freeze • water saturation pressure is an exponential function of temperature • small changes in temperature have a large effect on the amount of water that can be present as water vapour • Every day’s examples: • dry air in heated rooms • “fogging” of glasses • white plumes above chimneys
Measurements of air humidity I • hair hygrometer • effect: detection of change of length of a human (or horse) hair in response to relative humidity changes • hair length changes as in keratin hydrogen bonds are broken in the presence of water vapour • slow response • capacity hygrometer • effect: hygroscopic polymer is placed between two electrodes. In the presence of water vapour, the volume of the polymer increases, decreasing the capacity of the device • are easily contaminated • absorption hygrometer • absorption spectroscopy on H2O can also be used to measure water vapour concentration
Measurements of air humidity II • dew point hygrometer • effect: detection of dew on temperature controlled mirror by observation of change in reflectance • very accurate • psychrometer • effect: T-difference between two ventilated thermometers, one of which is covered by a wet wick (wet bulb temperature). T-difference is proportional to relative humidity • use: • e = esat wet – c (Tdry - Twet) water vapour saturation pressure at Twet water vapour partial pressure
Measurements of air pressure • mercury barometer • effect: air weight is balanced by mercury weight in a tube which is open on one end • use: Δp = p2 – p1 = ρgh • aneroid barometer • effect: sealed metal box with reduced internal air pressure is contracting and expanding in response to pressure changes = 0 density of mercury gravitational acceleration
Measurements of wind speed and direction • wind vane • effect: vane aligns in air flow • windsock • effect: sock aligns in wind flow and changes shape depending on wind speed (qualitatively) • cup anemometer • effect: pressure differences produce force on cups which rotate proportional to wind speed • problems: only wind speed in one plane, slow response, overshooting • (ultra)sonic anemometer • effect: measurement of sound velocity • all 3 wind components, fast, no inertia, simultaneous virtual temperature measurement • hot wire anemometer • effect: energy loss of a heated wire • very fast but fragile
Cup anemometer measurements of wind speed • force balance for cup anemometer: • F1=1/2 Cd1ρA(U – Ux)2 • F2=1/2 Cd2ρA(U + Ux)2 • Cd1ρA(U – Ux)2 = Cd2ρA(U + Ux)2 • where • Cd1 and Cd2 are the drag coefficients for the concave and convex side of the cup • A is the area of the cup • U is the wind speed • Ux is the tangential speed of the cups • ρ is the density of air • => angular velocity of the cup anemometer is proportional to the wind speed • 3 cup anemometers have larger torque and react faster to changes in wind speed • conical cups are better • rings for turbulence suppression help
Measurements of precipitation • rain gauge • effect: precipitation is collected and the amount measured e.g. by a tipping bucket. Precipitation collector is heated to convert hail and snow to water • optical rain gauge • effect: particles passing through a light beam cause scintillations http://www.usatoday.com/weather/wtipgage.htm Problems in measurements of precipitation • gauge may alter air flow and thus precipitation locally • wind shields are necessary • optical measurement relies on assumptions on droplet size
Measurements of upper air weather • radio sonde • small instrument package (temperature, pressure, relative humidity) connected to a balloon filled e.g. with helium. The balloons usually burst at about 30 km. Data is sent to ground via radio transmission • ozone sonde • radio sonde which also contains an ozone monitor • rawinsonde • radiosonde that tracks its position in space and time allowing determination of wind speed and direction • dropsonde • sonde that doesn’t ascend with a balloon but is falling on a parachute after being dropped from an airplane
Weather Radar I • RAdio Detection And Ranging • effect: radio wave pulses are emitted and scattered back by precipitation particles. From the time between emission and detection, the distance can be computed; the signal intensity depends on the concentration of scatterers, the size of the particles and their type (snow, hail, rain). Radar data is usually shown as reflectivity in decibels. • use: • distance d = (c t) / 2 • maximum distance dmax = c / (2 PRF) (PRF = pulse repetition frequency) • problems: large dependence on particle radius, dependence on type of scatterer, other echoes
Weather Radar II • Doppler Radar (Doppler mode, velocity mode) • effect: using the Doppler effect, the direction and speed of precipitation can be determined • Wind profiler • effect: using the Doppler effect, Radar can provide vertical wind speed in the absence of precipitation by using the echoes from aerosols, insects or turbulence eddies http://weather.noaa.gov/radar/mosaic/DS.p19r0/ar.us.conus.shtml reflectivity relative speed one hour rain fall
Reminder: radiation in the atmosphere • Short wave radiation: • comes from the sun • about half reaches the ground • about 30% is reflected / scattered back • rest is absorbed • Long wave radiation: • is absorbed and re-emitted in the atmosphere • emitted from the surface • counterradiation from the atmosphere
Radiation measurements I • Pyrheliometer: direct sunshine • Angstrom compensation pyrheliometer • effect: two manganin strips, one heated by the sun, the other electrically until they have the same temperature. The current needed is proportional to the incoming short wave radiation • Pyranometer: short wave radiation on a plane • Kipp solarimeter • effect: thermopile under two domes (0.3 – 3 μm transmission + radiation shield + aspiration to establish radiance balance) measures temperature difference between housing and detector • Eppley pyranometer • effect: as Kipp solarimeter, but temperature difference between black and white sectors of the detector are measured
Radiation measurements II • Pyrgeometer: long wave radiation • effect: as for pyranometers, only that dome is transparent for 3 – 50 μm radiation • Net radiometer: total net long and short wave radiation • either two instruments or one combined instrument with ventilated polyethylene dome and carefully balanced detector response • energy balance radiation measurements: • shortwave and longwave incoming radiation • longwave radiation from the dome(s) • heat conduction to the housing • convective heat losses • temperature of housing and dome (for pyrgeometer) is measured • good ventilation crucial • good radiation shields needed
Satellite imagery • visible images • show thick clouds as bright white areas. Brightness is determined by cloud droplet size • IR images (10 – 12 μm) • show high (cold) clouds as bright areas, low (warm) clouds as grey areas. Together with vertical profiles of temperature and assumptions on emissivity, cloud top altitude can be determined • H2O images (6.5 – 6.9 μm) • provide information on the water vapour content of the atmosphere, mainly between 500 and 200 mbar. • measurements at different IR wavelengths • can also provide indication on the phase (liquid vs. ice) of cloud particles • image sequences • show movement of clouds which can be converted to wind velocities at different altitudes
Summary • meteorology depends on frequent and accurate measurements of the basic quantities air temperature, wind speed and direction, pressure, humidity, cloud distribution, cloud type, type and amount of precipitation and radiation • standard instruments are available for most of the quantities on the surface using different techniques • sonding and remote sensing is used for upper air weather measurements • satellite meteorology gets more and more important but can not replace surface measurements Some References to sources used • http://www.physics.uwo.ca/~whocking/p103/instrum.html • http://de.wikipedia.org • http://www.met.wau.nl/education/fieldpract/field%20course%20micrometeorology%202005.pdf • http://weather.noaa.gov/radar/mosaic/DS.p19r0/ar.us.conus.shtml • http://www.usatoday.com/weather/wmeasur0.htm