Introduction to Measurement Techniques in Environmental Physics
250 likes | 452 Vues
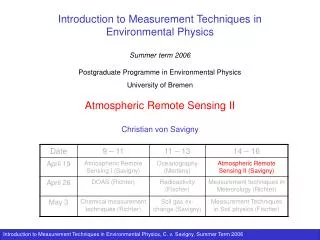
Introduction to Measurement Techniques in Environmental Physics University of Bremen, summer term 2006 Differential Optical Absorption Spectroscopy (DOAS) Andreas Richter ( richter@iup.physik.uni-bremen.de ). Overview. Principle of DOAS measurements DOAS instrument

Introduction to Measurement Techniques in Environmental Physics
E N D
Presentation Transcript
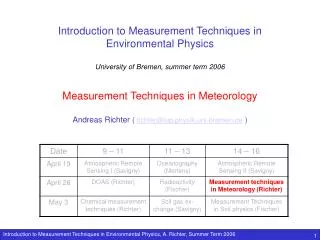
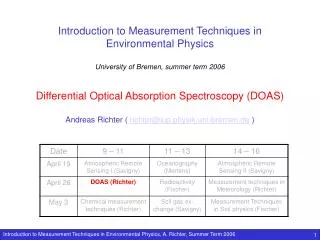
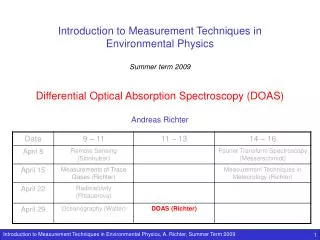
Introduction to Measurement Techniques in Environmental Physics University of Bremen, summer term 2006 Differential Optical Absorption Spectroscopy (DOAS) Andreas Richter ( richter@iup.physik.uni-bremen.de )
Overview • Principle of DOAS measurements • DOAS instrument • calibration of DOAS measurements • DOAS data analysis • DOAS applications
Basic ideas of DOAS measurements • remote sensing measurement of atmospheric trace gases in the atmosphere • measurement is based on absorption spectroscopy in the UV and visible wavelength range • to avoid problems with extinction by scattering or changes in the instrument throughput, only signals that vary rapidly with wavelength are analysed (thus the differential in DOAS) • measurements are taken at moderate spectral resolution to identify and separate different species • when using the sun or the moon as light source, very long light paths can be realised in the atmosphere which leads to very high sensitivity • even longer light paths are obtained at twilight when using scattered light • scattered light observations can be taken at all weather conditions without significant loss in accuracy for stratospheric measurements • use of simple, automated instruments for continuous operation
Measured Spectrum The MAXDOAS instrumentMAXDOAS = Multi Axis Differential Optical Absorption Spectroscopy Schematic Instrument Telescope
The (MAX)DOAS instrument • Differential Optical Absorption Spectroscopy • idea: similar as for Dobson Spectrophotometer, but measurements at many wavelengths facilitating simultaneous retrieval of several absorbers. • observation of scattered light in the zenith or horizon directions to achieve long light paths • temperature stabilised grating spectrometer to guarantee high stability • cooled diode arrays or CCD detectors to minimize noise and provide simultaneous measurements at all wavelengths • spectral range between 320 and 700 nm • spectral resolution 0.2 – 1 nm • use of depolarizing quartz fibre bundles or polarized instrument tracking the solar azimuth to minimize impact of polarisation dependency • target species: O3, NO2, BrO, IO, OClO, SO2, H2O, HCHO, O4, O2, ... • operation from ground, ship, aircraft, balloons, satellites
Light paths for scattered light observations • zenith-sky pointing • short light path through the troposphere • longer light path through the stratosphere • very long light path through the stratosphere at low sun • clouds don’t change the light path in the stratosphere • => twilight is best time for stratospheric measurements • horizon pointing • long light path through the lower troposphere • constant light path through the stratosphere • the lower the measurement is pointed, the longer the light path gets • small dependence on sun position • clouds strongly change light path • => tropospheric measurements work best during the day
Multiple light paths • In practice, many light paths through the atmosphere contribute to the measured signal. • Intensity measured at the surface consist of light scattered in the atmosphere from different altitudes • For each altitude, we have to consider • extinction on the way from the top of the atmosphere • scattering probability • extinction on the way to the surface • in first approximation, the observed absorption is then the absorption along the individual light paths weighted with the respective intensity. SZA Offset for clarity only!
Airmass factors VC SC • The airmass factor (AMF) is the ratio of the measured slant column (SC) to the vertical column (VC) in the atmosphere: • The AMF depends on a variety of parameters such as • wavelength • geometry • vertical distribution of the species • clouds • aerosol loading • surface albedo The basic idea is that the sensitivity of the measurement depends on many parameters but if they are known, signal and column are proportional
Airmass factors: dependence on solar zenith angle (SZA) For a stratospheric absorber, the AMF strongly increases with solar zenith angle (SZA) for ground-based, airborne and satellite measurements. Reason: increasing light path in the upper atmosphere (geometry) For an absorber close to the surface, the AMF is small, depends weakly on SZA but at large SZA rapidly decreases. Reason: light path in the lowest atmosphere is short as it is after the scattering point for zenith observation. => stratospheric sensitivity is highest at large SZA (twilight) => tropospheric sensitivity is largest at high sun (noon) => diurnal variation of slant column carries information on vertical profile
Airmass factors: dependence on absorber altitude • The AMF depends on the vertical profile of the absorber. The shape of the vertical dependence depends on wavelength, viewing geometry and surface albedo. • For zenith-viewing measurements, the sensitivity increases with altitude (geometry). • For satellite nadir observations, the sensitivity is low close to the surface over dark surfaces (photons don’t reach the surface) but large over bright surfaces (multiple scattering). • => the vertical profile must be known for the calculation of AMF
Airmass factors: dependence on wavelength • the AMF depends on wavelength as Rayleigh scattering is a strong function of wavelength and also the absorption varies with wavelength • at low sun, the AMF is smaller in the UV than in the visible as more light is scattered before travelling the long distance in the atmosphere. • at high sun, the opposite is true as a result of multiple scattering • UV measurements are more adequate for large absorption • in the case of large absorptions, the nice separation of fit and radiative transfer is not valid anymore as AMF and absorption are correlated • different wavelengths “see” different parts of the atmosphere which can be used for profile retrieval
Airmass factors: dependence on viewing direction • by looking at the horizon, the light path in the lower atmosphere is greatly enhanced • the lower the pointing, the larger the sensitivity • good visibility is needed (no effect in fog) • combining measurements in different directions can be used to derive vertical profile information
DOAS equation I The intensity measured at the instrument is the extraterrestrial intensity weakened by absorption, Rayleigh scattering and Mie scattering along the light path: scattering efficiency integral over light path unattenuated intensity absorption by all trace gases j extinction by Mie scattering extinction by Rayleigh scattering exponential from Lambert Beer’s law
DOAS equation II if the absorption cross-sections do not vary along the light path, we can simplify the equation by introducing the slant column SC, which is the total amount of the absorber per unit area integrated along the light path through the atmosphere:
DOAS equation III As Rayleigh and Mie scattering efficiency vary smoothly with wavelength, they can be approximated by low order polynomials. Also, the absorption cross-sections can be separated into a high (“differential”) and a low frequency part, the later of which can also be included in the polynomial: differential cross-section slant column polynomial
DOAS equation IV Finally, the logarithm is taken and the scattering efficiency included in the polynomial. The result is a linear equation between the optical depth, a polynomial and the slant columns of the absorbers. by solving it at many wavelengths (least squares approximation), the slant columns of several absorbers can be determined simultaneously. intensity with absorption (the measurement result) absorption cross-sections (measured in the lab) intensity without or with less absorption (reference measurement) polynomial (bp* are fitted) slant columnsSCj are fitted
Example of DOAS data analysis measurement optical depth differential optical depth NO2 O3 residual H2O Ring
Application example: MAXDOAS measurements of HCHO • Formaldehyde (HCHO) is an intermediate product in atmospheric oxidation of hydrocarbons • key role in ozone smog formation • sources of precursors both biogenic and anthropogenic • multi-axis measurements in Po valley (Italy) • different viewing directions provide profile information • large increase as wind direction changed and brought air from Milano to measurement site • good agreement with independent in-situ measurements Heckel, A., A. Richter, T. Tarsu, F. Wittrock, C. Hak, I. Pundt, W. Junkermann, and J. P. Burrows, MAX-DOAS measurements of formaldehyde in the Po-Valley, Atmos. Chem. Phys. Discuss., 4, 1151–1180, 2004
The sun as a light source • the solar spectrum can be approximated by a black body at temperature 5780K • absorption in the solar atmosphere leads to Fraunhofer lines • in the atmosphere, the solar radiation is attenuated by scattering and absorption • strong absorption by O3, O2, H2O und CO2 • there are some atmospheric windows where absorption is small • multitude of Fraunhofer lines • 11 year solar cycle, particularly relevant at short wavelengths < 300 nm • spectrum varies over the solar disk • Doppler shift resulting from rotation of sun • variation of intensity due to changes in distance sun - earth • => sun is not an ideal light source!
Wavelength calibration for DOAS measurements • The raw signal measured on the detector needs to get an accurate wavelength assignment • Basic idea: • several emission lines of known wavelength position are recorded • linear regression between detector number / grating position and wavelength provides dispersion • Problems: • dispersion is not necessary linear • emission lines are not evenly distributed • reproducibility not always guaranteed • Solution: • measurements of solar light can use Fraunhofer lines for calibration • higher order polynomials can be used as calibration function Intensity Pixel a Wavelength [nm] b Pixel Wavelength[nm] = a Pixel + b
Instrument function for DOAS measurements • The Instrument Response Function IRF (often also called slit function) is the response of the instrument to a monochromatic input • For an arbitrary input signal, the output can be computed by convolution of the input y() with the IRF F(): • The IRF can be measured by illuminating the instrument with a monochromatic light source. • The IRF also depends on how well the entrance aperture of a diffraction monochromator is illuminated (=> problems with partially cloudy skies). • Sometimes the IRF is numerically degraded by smoothing the measurements to reduce noise. Instrument
Example: Instrument function • GOME slit function is approximated by Gauss function of varying FWHM => Only after two data sets have been brought to the same spectral resolution (not sampling!) they can be compared.
Long Path DOAS measurements • advantages: • measurements at night • well defined light path • extension to UV (no ozone layer in between) • disadvantages: • shorter light path • need for bright lamp (+ power) • usually not fully automated • Instrument: • open path DOAS system using a lamp as light source • retro reflectors for simplified set-up • white cells (multi reflection) for enhanced light path possible spectrometer detector retro reflectors quartz fibre telescope open path through the atmosphere lamp
1996 - 2002 Example for satellite DOAS measurements • Nitrogen dioxide (NO2) and NO are key species in tropospheric ozone formation • they also contribute to acid rain • sources are mainly anthropogenic (combustion of fossil fuels) but biomass burning, soil emissions and lightning also contribute • GOME and SCIAMACHY are satellite borne DOAS instruments observing the atmosphere in nadir • data can be analysed for tropospheric NO2 providing the first global maps of NOx pollution • after 10 years of measurements, trends can also be observed GOME annual changes in tropospheric NO2 A. Richter et al., Increase in tropospheric nitrogen dioxide over China observed from space, Nature, 4372005
Summary • DOAS measurements use absorption spectroscopy to detect trace gases in the atmosphere • the basic law applied is Lambert Beer’s law • only the “differential” part, i.e. the high frequency component is used to separate molecular absorption from extinction by scattering • as light source, the sun (or moon or stars), scattered light or a lamp can be used • for scattered light applications, computation of the light path through the atmosphere is the most difficult part of the data analysis • the instruments used are grating spectrometers with diode array or CCD detectors connected to a telescope • high stability is needed to minimise artefacts from solar Fraunhofer lines • DOAS instruments can be operated from all kind of platforms including satellites