Download
1 / 19
190 likes | 318 Vues
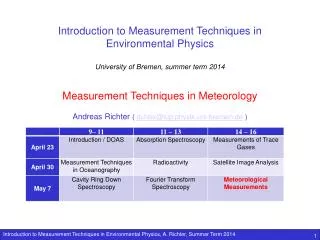
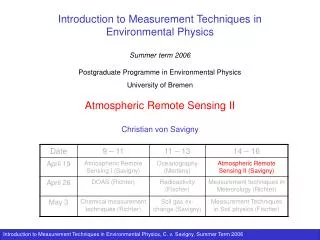
Introduction to Measurement Techniques in Environmental Physics Summer term 2006 Postgraduate Programme in Environmental Physics University of Bremen Atmospheric Remote Sensing II Christian von Savigny. Overview – Lecture 2.

E N D
Introduction to Measurement Techniques in Environmental Physics Summer term 2006 Postgraduate Programme in Environmental Physics University of Bremen Atmospheric Remote Sensing II Christian von Savigny
Overview – Lecture 2 • Principle of wavelength pairing to remotely sense atmospheric O3 and also other constituents • Overview of retrieval Techniques for atmospheric remote sensing of atmospheric constituents • Emission measurements • Nadir-Backscatter • Occultation • Limb-scattering • Retrieval example: onion-peel inversion of solar occultation measurements
Cross secton 1 2 Note: Absorption cross section typically also dependent on x Complication: Light path dependent on Known from measurements of solar spectrum Absorber column amount along effective light path Principle of wavelength pairs (online - off-line)
Dobson’s spectrophotometer I Quartz plates Ajustable wedge Fixed slits Prisms Detector: photomultiplier Org. photographic plate Detailed description also to be found in script
Dobson’s spectrophotometer II Used wavelength pairs Longest existing ozone time series
Overview of satellite observations geometries Measured signal: Directly transmitted solar radiation Measured signal: Reflected and scattered sunlight Measured signal: Scattered solar radiation
Ozone measurements using emissions • Usually measure longwave radiation thermally emitted by the atmosphere along theline of sight of the instrument • Infrared (9.6 μm ozone band), microwave, and NIR wavelengths (760nm, 1270 nm) • Limb sounding or nadir sounding viewing geometries • Used to retrieve ozone profiles and total columns Example:Mesospheric O3 profiles retrieved from O2(1) measurements Main source of O2(1) in dayglow: photolysis of ozone O3 + h O2(1)JO3 O2(1) O2 + h AO2 Simplified chemistry !! Change in O2(1): AO2[O2(1)]: volume emission rate, measured quantity Steady state:[O3] = AO2[O2(1)] / JO3 retrieve [O3]
Backscatter UV Ozone measurements I • Solar UV radiation reflected from the surface and backscattered by atmosphere or clouds is absorbed by ozone in the Hartley-Huggins bands (< 350 nm) • Note: • most ozone lies in stratosphere • most of the backscattered UV radiation comes from the troposphere • little absorption by ozone occurs in the troposphere • little scattering occurs in the stratosphere • radiation reaching the satellite passes through the ozone layer twice • Backscatter UV measurements allow retrieval of total O3 columns and also vertical profiles, but with poor vertical resolution (7 – 10 km) • Measure O3 slant column and use Radiative transfer model to convert to vertical column
Backscatter UV Ozone measurements II Examples: BUV (Backscatter Ultraviolet) instrument on Nimbus 4, 1970-1977 SBUV (Solar Backscatter Ultraviolet) instrument on Nimbus 7, operated from 1978 to 1990 SBUV/2 (Solar Backscatter Ultraviolet 2) instrument on the NOAA polar orbiter satellites: NOAA-11 (1989 -1994), NOAA-14 (inorbit)can measure ozone profiles as well as columns TOMS (Total Ozone Mapping Spectrometer)first on Nimbus 7, operated from 1978 to 1993. Then three subsequent versions: Meteor 3 (1991-1994), ADEOS (1997), Earth Probe (1996-). Measures total ozone columns. GOME (Global Ozone Monitoring Experiment)launched on ESA's ERS-2 satellite in 1995employs a nadir-viewing BUV technique that measures radiances from 240 to 793 nm. Measures O3 columns and profiles, as well as columns of NO2, H2O, SO2, BrO,OClO.
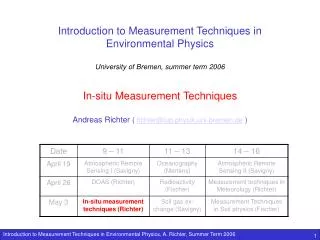
Solar occultation measurements I I0() spectrum at the highest tangent altitude with negligible atmospheric extinction I(,zi) spectrum at tangent altitude zi within the atmosphere LoS: line of sight With kext, being the total extinction coefficient at position s along the line of sight LoS. Extinction is usually due to Rayleigh-scattering, aerosol scattering and absorption by minor constituents:
Absorption cross-section O3 Number density Solar occultation measurements II Due to the different spectral characteristics of the different absorbers and scatterers the optical depth due to, e.g., O3 can be extracted. If we assume that the cross-section does not depend on x, i.e., not on temperature and/or pressure, then With the column density c(zi) The measurement provides a set of column densities integrated along the line of sight for different tangent altitudes zi. Inversion to get vertical O3 profile Disadvantage of solar occultation measurements: The occultation condition has to be met: Measurements only possible during orbital sunrises/sunsets For typical Low Earth Orbits there are 14–15 orbital sunrises and sunsets per day poor geographical coverage
Solar occultation measurements III Examples: SAGE (Stratospheric Aerosol and Gas Experiment) Series provided constinuous observations since 1984 to date Latest instrument is SAGE III on a Russian Meteor-3M spacecraft HALOE (Halogen Occultation Experiment) on UARS (Upper Atmosphere Research Satellite) operated from 1991 until end of 2005, employing IR wavelengths POAM (Polar Ozone and Aerosol Measurement) series use UV-visible solar occultation to measure profiles of ozone, H2O, NO2, aerosols GOMOS (Global Ozone Monitoring by Occultation of Stars) on Envisat will performs UV-visible occultation using stars SCIAMACHY (Scanning Imaging Absorption spectroMeter for Atmospheric CHartographY) on Envisat performs solar and lunar occultation measurements providing e.g., O3, NO2, and (nighttime) NO3 profiles.
Modelled limb-radiance profiles At 280 nm Optically thin regime “Knee” Optically thick regime Limb scatter measurements I • Radiation is detected which is scattered into the field of view of the instrument along the line of sight and also transmitted from the scattering point to the instrument • Solar radiation pickts up absorption signatures along the way • Also: Light path can be modified by atmospheric absorption • Vertical profiles of several trace constituents can be retrieved fom limb- scattered spectra emplying a radiative transfer model (RTM) to simulate the measurements • Retrieval without forward model not possible
Limb scatter measurements II Examples: SME (Solar Mesosphere Explorer)launched in 1981, carried the first ever limb scatter satellite instruments. Mesospheric O3 profiles were retrieved using the Ultraviolet Spectrometer and stratospheric NO2 profiles were retrieved using the Visible Spectrometer MSX satellite – launched in 1996 , carried a suite of UV/visiblesensors (UVISI) SOLSE(Shuttle Ozone Limb Sounding Experiment) flown on the Space Shuttle flight in 1997. Provided good ozone profiles with high vertical resolution down to the tropopause OSIRIS (Optical Spectrograph and Infrared Imager System) launched in 2001 on Odin satellite. Retrieval of vertical profiles of O3, NO2, OClO, BrO SCIAMACHY (Scanning Imaging Absorption SpectroMeter for Atmospheric CHartographY), launched on Envisat in 2002. Retrieval of vertical profiles of O3, NO2, OClO, BrO and aerosols
Advantages and disadvantages of measurement techniques: TECHNIQUEADVANTAGESDISADVANTAGES Emission•doesn’t require sunlight •slightly less accurate than •long time series backscatter UV •simple retrieval technique •long horizontal path for limb obs. •provides global maps twice a day (good spatial coverage) Backscatter UV•accurate • requires sunlight, so can’t be • long time series used at night or over winter poles • good horizontal resolution • poor vertical resolution below the due to nadir viewing ozone peak (~30 km) due to the effects of multiple scattering and reduced sensitivity to the profile shape Occultation• simple equipment • can only be made at satellite • simple retrieval technique sunrise and sunset, which limits • good vertical resolution number and location of meas. • self-calibrating • long horizontal path Limb Scattering• excellent spatial coverage • complex viewing geometry • good vertical resolution • data can be taken nearly • poor horizontal resolution continuously
Sun (TH1) (TH2) (TH3) (TH4) (TH5) • • • Example: Onion peel inversion of occultation observations a22 a11 a21/2 a32/2 xi : O3 concentration at altitude zi yj : O3 column density at tangent height THj Earth x4 x3 x2 x1 x5 The matrix elements aij correspond to geometrical path lengths through the layers
Unconstrained least squares solution Inverse of A exists if the determinant of A is not zero Standard approach: least squares solution (assume N=M) Minimize: by: This leads to:
Constrained least squares solution Add additional condition to constrain the solution, e.g.: is a smoothing or constraint coefficient coefficient