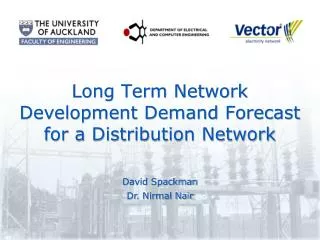
Long Term Network Development Demand Forecast for a Distribution Network
Long Term Network Development Demand Forecast for a Distribution Network. David Spackman Dr. Nirmal Nair. Long Term Network Development Demand Forecast for a Distribution Network. Summary: Vector needed a long-term electricity demand forecast This will feed into their long-term plans

Long Term Network Development Demand Forecast for a Distribution Network
E N D
Presentation Transcript
Long Term Network Development Demand Forecast for a Distribution Network David Spackman Dr. Nirmal Nair
Long Term Network Development Demand Forecast for a Distribution Network • Summary: • Vector needed a long-term electricity demand forecast • This will feed into their long-term plans • Designed a new long-term forecast methodology: the ‘policy-guided model’ • Tested on Vector’s Auckland network and obtained promising results
Outline • Background • Forecast Model • Results • Future work • Conclusions
Vector Electricity Network • Largest distribution company in NZ • Auckland, Northern, Wellington • 660,000 connections • Zone substations: 123 • Distribution substations: 24,000 • Planning for demand growth • 10-15 year forecasts • Long-Term Forecasting: • Strategic long-term (30-70 years) • Network asset investment • Purchasing land
Designing a Forecast Model • Many existing methods considered • Econometric • Artificial Neural Networks • Cellular Automata: Computer based Land Use Simulations • New methodology designed
Designing a Forecast Model Consider saturation of land From Willis, H.L., Spatial Electric Load Forecasting
Basis for Forecast Model More customers More demand per customer
Future Land Use: A Policy-Guided Approach • Auckland Regional Council sets land use rules ARC 2050 Growth Strategy
Processing District Plan Zoning Auckland City Council: 36 Classes Papakura District Council: 25 Classes Manukau City Council: 138 Classes Total: 199 Classes } Policy-guided model: 19 Classes • Zoning information readily available from Councils • Processing of this data was required • Simplification into classes defined by ‘electricity demand’
Electricity Demand for each Customer/Land Use Class • The 19 simplified zone classes need to be assigned load densities
Load Densities: Approach 1 Select feeders with one simplified zone class Remove feeders not fully developed Record area for each useful feeder (m2) Record peak load for each useful feeder (W) Res Low Open Space
Calculated Load Densities Land use class Land use class Load density (W/m2) Load density (W/m2) Open Space Open Space 0 Residential – Low Intensity Residential – Low Intensity 3.99 Residential – Medium Intensity Residential – Medium Intensity 5.82 Business – High Intensity Business – High Intensity 86.4 Industrial – Light Intensity Industrial – Light Intensity 11.54 … … … …
Load Densities: Approach 2 } Res • Further simplify zone classes • More areas to work with Res Low Res Med Res Med-High Res High
Approach 2 Results Residential Load Densities
Load Densities: Approach 3 • Smart Metering data • Finer resolution of load densities • Applicable now to some Commercial and Industrial customers
Combining • Applying load densities to zone classes x 107,886 m2 3.99 W/m2 430.5 kW
Scenario Analysis • Long-term horizon causes forecast to be scenario-dependent • A ‘Business-as-usual’ scenario to begin • Scenarios modify one or more variables of the model
Scenario Analysis • Examples: • New transport links • Rezoning of land • DSM, DG • Intelligent Buildings: EMCS
Scenario Analysis Scenarios classified as: • End-use change scenarios • eg. All Industrial peak demand increases by 5% 2. Re-zoning scenarios • eg. Tank Farm redevelopment • Industrial a Commercial + Residential 3. Micro-scale • Creation of new ‘zone’ for specific development 4. Macro-scale • Selection of areas based on other variables
Case Study Results • Auckland Region
Case Study Results • Scenario Analysis: Residential Growth • High infill of zones near a major transport corridor Height = Peak Demand
Verification • Found no other small area study to directly compare with, during our literature survey • However, small area should be consistent with larger area • Electricity Commission forecasts to 2040 for major industry investments • By obtaining their data we can align our forecast and check…
Application • Vector’s Long-term Strategic Network Development Plan • Australasian Universities Power Engineering Conference (AUPEC) Perth, Australia; December 2007 • Provisionally accepted, paper to be made available through IEEE Explore
Future Work • Update with new data as it becomes available • Include CBD method • Cross-checking ARC 2050 plan • Amendments current and future • Extend to: • Northern region • North Shore, Waitakere, Rodney • Wellington region • Wellington City, Lower Hutt, Upper Hutt, Porirua
Future Work Compare summed CAU results with an econometric model at CAU level: Use population, GDP forecasts (2-20 years max- extrapolate?) Need residential/commercial breakdown
Conclusions • Investigated various forecasting methods for a long-term forecast • Designed new long-term forecast methodology • Completed a forecast for Vector’s Auckland Region • Sum of Auckland Region forecast results compare well with Electricity Commission forecast Acknowledgements Auckland City Council Manukau City Council Papakura District Council • Vector • Guhan Sivakumar
Long Term Network Development Demand Forecast for a Distribution Network David Spackman Dr. Nirmal Nair