Download
1 / 15
150 likes | 293 Vues
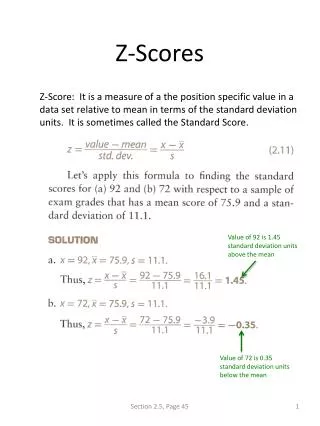
Seminar Eight Individual Z-Scores and Z-Score Patterns. Caitlin Crawford September 20, 2007. Calculating Z-Scores. All female heights have mean 65 and standard deviation 2.5 All male heights have mean 70 and standard deviation 3 Formula: z=(x-µ)/ σ

E N D
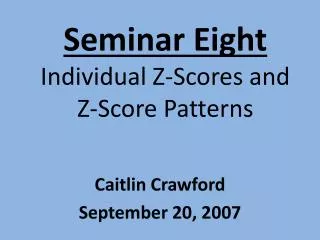
Seminar EightIndividual Z-Scores and Z-Score Patterns Caitlin Crawford September 20, 2007
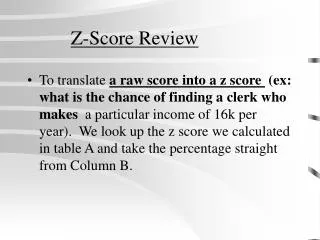
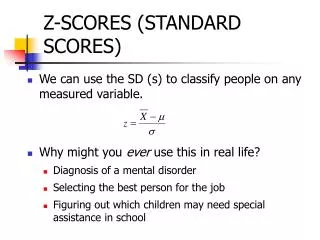
Calculating Z-Scores • All female heights have mean 65 and standard deviation 2.5 • All male heights have mean 70 and standard deviation 3 • Formula: z=(x-µ)/σ • In other words, the mean subtracted from your value, divided by the standard deviation
Constructing a Histogram • A histogram display values of a quantitative variable with vertical bars showing the count of values in certain interval ranges. • Steps: • Divide range of data into intervals of equal width • Find the count of observations in each interval. • Draw the histogram, using the horizontal axis for range of data and vertical axis for count
Commenting on Histogram • Are there large negative or positive z-scores? • What percentage of z-scores are less than 1, 2, or 3? - 68% of z-scores are between 1 and -1 - 95% of z-scores are between 2 and -2 - 99.7% of z-scores are between 3 and -3 • Do our results conform to 68-95-99.7 rule? • Would results differ for a larger class?
Example Two • How many minutes (to the nearest 10 minutes) did you spend doing homework yesterday?
Calculating Mean and Standard Deviation Steps for calculating by hand: • Find the mean (add up all the numbers and divide by how many there are) • Find the deviations from the mean • Find the squared deviations from the mean • “Average” the squared deviations, dividing their sum by the number of observations-1 • Take the square root of the variance to find the standard deviation
Calculating Z-Scores • Use a calculator to find your individual z-score • Formula: z=(x-µ)/σ • In other words, the mean subtracted from your value, divided by the standard deviation
Constructing a Histogram • A histogram display values of a quantitative variable with vertical bars showing the count of values in certain interval ranges. • Steps: • Divide range of data into intervals of equal width • Find the count of observations in each interval. • Draw the histogram, using the horizontal axis for range of data and vertical axis for count
Commenting on Histogram • Are there large negative or positive z-scores? • What percentage of z-scores are less than 1, 2, or 3? - 68% of z-scores are between 1 and -1 - 95% of z-scores are between 2 and -2 - 99.7% of z-scores are between 3 and -3 • Do our results conform to 68-95-99.7 rule? • Would results differ for a larger class?
Example Three • How many hours of sleep did you get last night? -Please round to the nearest half hour
Calculating Mean and Standard Deviation Steps for calculating by hand: • Find the mean (add up all the numbers and divide by how many there are) • Find the deviations from the mean • Find the squared deviations from the mean • “Average” the squared deviations, dividing their sum by the number of observations-1 • Take the square root of the variance to find the standard deviation
Calculating Z-Scores • Use a calculator to find your individual z-score • Formula: z=(x-µ)/σ • In other words, the mean subtracted from your value, divided by the standard deviation
Constructing a Histogram • A histogram display values of a quantitative variable with vertical bars showing the count of values in certain interval ranges. • Steps: • Divide range of data into intervals of equal width • Find the count of observations in each interval. • Draw the histogram, using the horizontal axis for range of data and vertical axis for count
Commenting on Histogram • Are there large negative or positive z-scores? • What percentage of z-scores are less than 1, 2, or 3? - 68% of z-scores are between 1 and -1 - 95% of z-scores are between 2 and -2 - 99.7% of z-scores are between 3 and -3 • Do our results conform to 68-95-99.7 rule? • Would results differ for a larger class?
The End Thanks for your participation!