Download
1 / 7
70 likes | 424 Vues
2014 LTSA Current Trends Scenario Results May 20,2014. Current Trends Scenario Highlights. Conditions existing today will generally continue into the future ERCOT’s basecase load forecast with the addition of small amounts LNG

E N D
2014 LTSA Current Trends Scenario Results May 20,2014
Current Trends Scenario Highlights • Conditions existing today will generally continue into the future • ERCOT’s basecase load forecast with the addition of small amounts LNG • Natural gas prices increase slowly but are generally considered low • No major changes to environmental regulations • Trends in capital cost for new resources are increasing at GDP with the exception of Solar PV which is declining thru the planning period • Modest increase in penetration of demand response • No specified reserve margin, generator additions for conventional and renewable resources are by economics only • No PTC
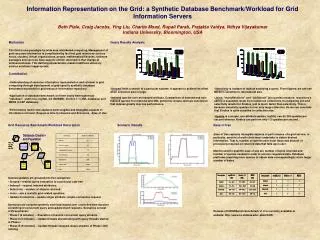
Current Trends Results • Thru 2029 – 5,450 MWs of CCs and 5,810 of CTs were built and 10,100 MWs of solar were built • Reserve margin increases through out the entire planning period to 12.8% in 2029 • 33 MWs of economic retirements and 8,789 MWs of fixed retirements
Current Trends with PTC Results • With the addition of the PTC 4,229 MWS of wind were built • Thru 2029 – 4,000 MWs of CCs, 6,250 MWs of CTs and 10,300 MWs of solar were built • Reserve margin increases through out the entire planning period to 11.4% in 2029 • 73 MWs of economic retirements and 8,789 MWs of fixed retirements
Proposed Scenarios for Analysis • Based on Stakeholder feedback the following scenarios were selected as important: • Stringent Environmental • High Economic Growth • High Efficiency/DG (may be merged with Stringent Environmental) • High Gas Price • Global Recession • Some interest was also shown for the Water Stress, High LNG Exports and High System Resilience scenarios
Questions? • Doug Murray • dmurray@ercot.com • 512-248-6908 • Julie Jin • Julie.jin@ercot.com • 512-248-3982
Scenario: Current Trends • Economic Growth • Migration to TX along I-35 corridor • Growth in south Texas • Industrial growth in Houston, I-35, Midland/Odessa, Valley • ~1.5% load growth – high growth in near term then tapering off in long-term • LNG growth based on permits existing – needs review • Oil production rates follow trend in recent EIA projections for Texas • Transmission Regulation /Policy • Policy set to reduce constraints • Increased DC-tie capacity with neighboring region • Higher reliability standards are set by NERCto avoid load shedding Story: Same old, same old. The recent population and economic growth in Texas continues in the near future, fueled largely by the continued growth of the oil and gas sector and the relative robust Texas economy compared to the rest of the U.S. World oil prices high enough to keep increasing oil production in the short-term, keeping domestic natural gas prices relatively low. With low gas prices, several LNG export terminals are built between 2014 and 2024. Modest wind growth continues based on economics without production tax credits. Capital costs for solar continues to decline at a slower rate than recent history. No required reserve margin is set for ERCOT and the environmental regulations continues to be moderate, with no explicit federal carbon tax or required national cap and trade, but greenhouse gas emissions become regulated beyond 2016. • Generation Resource Adequacy • No reserve margin set for ERCOT • Maintain energy-only market • Economic retirements continues based on economics • Environmental Regulation • MATS and 316B are implemented by 2016 • CSAPR Hybrid • Greenhouse gas regulation set with flexibility • No other major changes in environmental regulations • End-Use • Increased need for ancillary services • Increase penetration of demand response • Increasing distributed generation • Alternative Generation • Solar: 1000 MW / year • Wind capacity addition limit: 3,000 MW/yr • Capacity factor wind – rely on historical data from ERCOT • Capital cost wind ~$2,000/kW • Capital cost solar ~4.4% reduction/year • Overall renewable growth driven by economic entry • No production tax credit beyond 2013 • No change to existing investment tax credit policy • Implications for ERCOT: • Continued modest economic and therefore load growth in Texas. • Growth in oil production and population across the state leads to new transmission needs • Continued increased renewables leading to reliability (inertia) issues • No major generation retirements triggered by stringent environmental regulations. • Weather / Water • No drought situation, but water supply continues to be a concern to existing and new generators. • No specific increase in electricity consumption due to drought conditions. • Gas/Oil Prices • EIA reference case or best available gas and oil price forecasts