CURRENT TRENDS
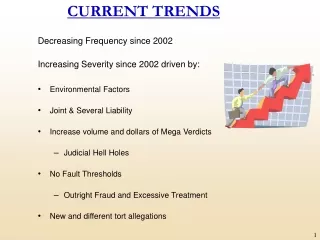
CURRENT TRENDS. Decreasing Frequency since 2002 Increasing Severity since 2002 driven by: Environmental Factors Joint & Several Liability Increase volume and dollars of Mega Verdicts Judicial Hell Holes No Fault Thresholds Outright Fraud and Excessive Treatment

CURRENT TRENDS
E N D
Presentation Transcript
CURRENT TRENDS Decreasing Frequency since 2002 Increasing Severity since 2002 driven by: • Environmental Factors • Joint & Several Liability • Increase volume and dollars of Mega Verdicts • Judicial Hell Holes • No Fault Thresholds • Outright Fraud and Excessive Treatment • New and different tort allegations
Reported Frequency-Bodily Injury Source: ISO
Changes in Severity of BI- 1997-2002 Source: IRC
Paid Severity-Bodily Injury Source: ISO
Urban vs. Rural • Auto accidents with damages alleged are more likely to occur in Urban areas, while fatalities are more likely in Rural Areas. • 80% of the crashes occurred in urban areas. • Injury claim frequencies were 29% higher in urban areas than in the rest of the country. • Collision claim frequencies were 33% higher in urban areas than in the rest of the country. • 70% of pedestrian deaths occur in the urban settings. Source: IRC and the Highway Data Institute
Age Related/Traffic Fatalities • In 2002, drivers older than 65 made up 12% of all traffic fatalities. • Of these fatalities, 81% occurred during the day, and 75% involved other vehicles. • In 2002, drivers older than 80 made up 50% of all traffic fatalities at intersections. • By 2030, driver 70 and older are projected to make up 25% of traffic fatalities. Source: National Highway Traffic Safety Administration-Feb 2004
Lawsuit Status of Claimants * Settled during Trail > 1% Source: IRC: Auto Injury Insurance Claims-2002
Results of Verdicts for Claimants Tried to Verdict Source: IRC: Auto Injury Insurance Claims-2002
Judicial Hellholes • Madison County, Illinois • Jefferson County (Beaumont), TX • 22nd Judicial circuit, MS • Hildalgo County, TX • Orleans Parish, LA • Kanawha County, WV • Nueces County, TX • Los Angeles County, CA • Philadelphia, PA • Miami-Dade County, FL • City of St. Louis, MO • Holmes and Hinds Counties, MS Green indicates county has been on the top list for 2 straight years.
Excessive Treatment Fraud • One third of all bodily injury claims for automobile accidents contain some element of fraud • The majority of the auto fraud is related to padding, build – up or exaggeration of claims • 33% of survey respondents said it was acceptable to exaggerate an insurance claim No-Fault Thresholds • 12 states and Puerto Rico have no-fault auto insurance laws: Florida, Michigan, New Jersey, New York, Pennsylvania, Hawaii, Kansas, Kentucky, Massachesetts, Minnesota, North Dakota and Utah. • New York between 1995 to 2000, the average paid per PIP claim rose 65% compared to 25% in other no-fault states. (Between 1992 and 2001, reports of suspected fraud soared 275%, mostly in no-fault. NYS, Ct of Appeals.) • “ Limited Tort Option” or Threshold Source: IRC, NYS Court of Appeals
Combating the Trends: Claims Representative - Claimant Relationship Issues • Communication is the number one concern for both Insurance and Corporate Litigation: • Direct Communication with Claimants • Timely initial contacts • Expectations set and met • Pro-active, early investigation • Follow up contacts • Early Resolution Opportunities • Better communication between Claims Adjusters and Claimants has lead to a decrease in Attorney Representation. Source: Insurance Risk Management Institute, IRC, Fulbright & Jaworski
Attorney Penetration by Coverage Source: IRC: Auto Injury Insurance Claims-2002
Combating the Trends: Claims Representative - Attorney Relationship Issues • Goals: • Expectations set by Insurers made clear to Defense Counsel. • Insurers want to reward early resolution, lowest overall claims cost, price certainty, and negotiated settlements, but rarely measure due to lack of reporting tools. • Insurers want quality, but mostly do not measure it or reward it. • Communication: • Audits performed by independent attorneys on Defense Counsels indicate that current procedures were put into place by Insurers due to prior exploitations by defense firms, not best practices. • Defense Counsel has issues dealing with claims adjusters with little experience controlling the outcome of cases. Avg. Age of a Caims Adjuster is 23 years old. • Defense Firms claim that Insurers are placing increasingly complex and onerous requirements on them. • Choice of Counsel: • Insurer’s Approved Panel Counsel List need to reflect experience and results and not focus primarily on cost. • Emphasis on greater utilization of Quality In-House Counsel Source: Insurance Risk Management Institute, Fulbright & Jawarski