Download
1 / 28
280 likes | 429 Vues
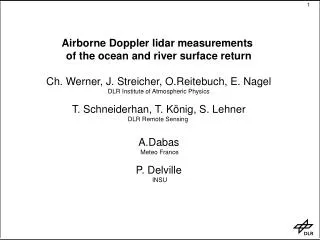
Impact Studies with Airborne Doppler Lidar Observations: A-TReC to T-PARC. Martin Weissmann, Andreas Dörnbrack, Stephan Rahm, Oliver Reitebuch Institut für Physik der Atmosphäre, DLR Oberpfaffenhofen, Germany Carla Cardinali ECMWF, Reading, UK. Doppler lidar 20° off nadir. dropsondes,

E N D
Impact Studies with Airborne Doppler Lidar Observations: A-TReC to T-PARC Martin Weissmann, Andreas Dörnbrack, Stephan Rahm, Oliver Reitebuch Institut für Physik der Atmosphäre, DLR Oberpfaffenhofen, Germany Carla Cardinali ECMWF, Reading, UK
Doppler lidar 20° off nadir dropsondes, u, v, t, rh, p DLR lidar systems DIAL new 4 wavelength water vapour DIAL l~920-945 nm, 100 Hz, > 2 W parameter: water vapour molecule number nadir pointing (zenith is possible) horiz. resolution: 2 - 40 km vert. resolution: 300 - 500 m high spectral resolution • scanning coherent 2 µm Doppler lidar: • step-and-stare scan with 24 positions • 24 LOS observations (~30/54 s) • vertical profile of 3-D wind vector horiz. resolution 5 - 40 km vert. resolution 100 m • range: 0.5-12 km • recording of every single shot (500 Hz) • correction with ground return
DLR participation in the Atlantic THORPEX Regional Campaign (14 - 28 November 2003) 4 flights in "sensitive areas" (targeting) 1 flight for Greenland Tip Jet 1 flight for intercomparison ASAR and lidar 2 transfer flights ======================================= 8 flights, 1600 wind profiles, 40 000 lidar observations, 49 dropsondes
Observations on 25 November 2003 (A-TReC) Iceland Ireland http://www.sat.dundee.ac.uk/ 1 scan revolution (res. ~10 km) 25 values per profile (2500 m) coverage = 36% 4 scan revolutions (res. ~40 km) 38 values per profile (~3800 m) coverage = 54% ECMWF sensitivity plot and 500 hPa
Error lidar (u,v): RMS = 0.75-1 m/s Statistical intercomparison of lidar and dropsondes Weissmann et al. 2005 (JTECH)
40 km x 40 km Dropsonde (2000 times enlarged) (Isaksen 2005) Assigned errors in ECMWF data assimilation Observational error lidar: 0.75-1 m/s Rep. error < 0.5 m/s (Frehlich and Sharman 2004) Assigned error: 1-1.5 m/s Radiosonde/Dropsonde: (most accurate operational wind observation) Observational error <0.5 m/s Assigned error: 2-3 m/s Assigned error AMV: 2-5 m/s
Background departures Background departure = difference background and observation (Std(bg-dep))2 = (Stdobs)2 + (Stdbg)2
Experiments with ECMWF T511 global model 6 experiments 14-30 November 2003 lidar, ~10 km, Std = 1 m/s lidar, ~40 km (2 averaging types), Std = 1 m/s lidar, ~40 km, Std =1.5 m/s ~100 dropsondes (from 10 flights) control run thinning to grid points (40 x 40 km, 60 levels) ~ 80% not used ~ 3000 used measurements 5 million operational measurements used per day lidar = 0.005% additional measurements 4 un-cyled experiments to investigate targeted observations (forecast sensitivity)
Observation influence (22 November 2003) northern hemisphere AMV: 0.15 Raso: 0.3 observation influence (Cardinali et al. 2004): 0 --> no influence of observations 1 --> no influence of background
area: 17 x 10-6 km2 Reduction of forecast error - 96 h (gpdm)
Reduction of forecast error - 500 hPa Mean reduction over Europe, averaged over 29 forecasts (2 weeks) black: experiments with lidar, gray: experiment with 100 dropsondes
Relative reduction of RH forecast error - 48, 72, 96 h • Reduction of u, v, z, rh, and t forecast errors Weissmann and Cardinali 2007, QJ
large, significant improvement in a few events, but the judgement for a future satellite mission needs to show: the impact in different areas, flow regimes and for many cases? a reliable quantification of the impact? the impact in different assimilations systems? the sensitivity to accuracy and resolution? Why do we need more studies?
DLR NOAA A-TReC targeting campaigns 20031115 at 18 Step42 20031120 at 18 Step54 Cut off low; heavy precipitation in SE-Spain Heavy rain/strong wind in Portugal and NW-Spain 20031125 at 18 Step30 20031122 at 18 Step66 Strong winds –northwest Europe Heavy rain, Scotland and Norway
The influence of targeted observations main conclusion: we need more cases A-TReC cases were not ideal: planning needs to be improved maximum of sensitive area out of reach for the aircraft period with no high impact weather event and without low forecast error + +
What we could do with more data evaluate targeted observations and determine impact in different flow regimes larger data set is needed for sensitivity studies to determine the optimal configuration of future satellite Doppler lidar (e.g. reduce to LOS or resolution) investigate the value of future operational observation targeting (e.g. with satellite lidar) test targeting strategies derive parameters for the simulation of future satellite systems (observations in cloud gaps, correlation of backscatter and humidity, ground return over the sea etc.)
THORPEX Pacific Asian Regional Campaign (T-PARC), autumn 2008 airport base: Yokota, Japan flight time: 120 h including transfer period: 7 weeks costs: M$ 1.7 (80% funded) funding agencies: DLR, NSF, JMA, ESA, FZK/IMK, Canada, EUCOS, Korea (?) range of DLR Falcon aircraft
Megi(2004) Mindulle(2004) Aere(2004) Meari(2004) Nockten(2004) Nanmadol(2004) Conson(2004) Nida(2004) Wu et al. (2006)
Impact studies with DIAL water vapour data WV mixing ratio [mg/kg] Iceland Greenland 13 May 2002 14 May 2002 15 May 2002 Germany North America Studies with Elias Holm, ECMWF
17 analysis with lidar data (11 down, 6 upward looking) 30 000 lidar observations ongoing: new quality control sensitivity studies (e.g. no coupling with wind)
Comparison of key analysis errors and lidar analysis departures • no correlation found between key analysis errors and lidar analysis departures or analysis diff. • neither statistical correlation nor qualitative similarity • same for B-matrix norm and total energy norm • this confirms that results of Isaaksen et al 2005 that KAEs draw the analysis away from obs., • but now it is also shown for data sparse regions • -raises the question what KAEs describe • results submitted to Meteorologische Zeitschrift (Koch, Ehrendorfer and Weissmann 2007)
Summary significant improvement of ECMWF forecasts fields (wind, temperature, and humidity) (~3% for 2-4 day forecasts over Europe) lower assigned error than all other current wind observations --> higher observation influence more data is needed for sensitivity studies, a more accurate quantification of the improvement, and the evaluation of observation targeting some targeted lidar observations during COPS/E-TReC (ongoing at the moment) and THORPEX-IPY in spring 2008 what we need is a large consistent data set for statistically reliable conclusions • T-PARC, 20% funding missing, preparation needs to start soon (decision in September) • evaluate the impact in different assimilation systems: ECMWF, JMA, NRL, Canada... • additionally observations with TODWL on P-3? ground campaign with the ADM demonstrator ongoing at the moment: much stronger signal than before; flight campaign possibly 2008
range=0-2.5km range=2.5-5km range=5-7.5km range=7.5-12km Correlation of backscatter and humidity