Download
1 / 23
230 likes | 397 Vues
^. global Observing decadal variability in the oceans with altimetry and in situ data. Dean Roemmich 1 , Josh Willis 2 , and John Gilson 1 1 Scripps Institution of Oceanography, UCSD, 2 Jet Propulsion Laboratory OSTST Hobart, March 2007 Thanks to many contributors!.

E N D
^ globalObserving decadal variability in the oceanswith altimetry and in situ data Dean Roemmich1, Josh Willis2, and John Gilson1 1Scripps Institution of Oceanography, UCSD, 2Jet Propulsion Laboratory OSTST Hobart, March 2007 Thanks to many contributors!
Objective: Use global datasets (altimetry and in situ) to synthesize regional studies of decadal variability. Outline • Global patterns of decadal variability, 1993 – 2006. • S. Hemisphere subtropical/subpolar variability. • The tropical Pacific and Indian Ocean. • N. Hemisphere subtropical/subpolar variability. • Decadal variability in heat transport. • Global summary. Steric height, 0/2000 db 2006 annual average from Argo
Datasets and data products: • ALT: AVISO gridded (reference) altimetric height; 1993 – Aug 2006 (Ducet et al, 2000). • Argo: 150,000 Argo profiles from 2004-2006 gridded 1o x 1o x 1 month (similar to Coriolis product, which also uses non-Argo data). • HRX: High Resolution XBT transects. • WOCE and CLIVAR hydrographic sections. • Willis-A: 0-750 m, 1993-2006 gridded temperature; first guess based on ALT (Willis et al, 2004; similar to ARMOR product, Guinehut et al, 2004) • Willis-B: 0-750 m, 1993-2006 gridded temperature; in situ data only. • WOA01: World Ocean Atlas 2001 (combined data types, Conkright et al., 2002). • WGHC: WOCE gridded hydrographic climatology (station data only, WOCE-weighted, Gouretski and Koltermann, 2004). • NCEP/NCAR reanalysis wind stress. • WHOI FSI data (~210 out of 2800 presently active floats) excluded from Argo gridded datasets (including Willis); probably recoverable.
Two views of decadal change from ALT and steric height: ALT(AVISO): 2003/5 minus 1993/5 5o x 3o smoothed Altimetric SL rise 1993-2003 Steric height (Willis-B): 2003/5 minus 1993/5 5o x 3o smthed, 0/750 db In-situ SL rise (ARMOR) 1993-2003 - Southern subtropical gyres strengthened. - Southern Ocean warmed. - Western tropical Pacific/eastern Indian warmed. - NPC, NAC strengthened. - Northern subpolar gyres weakened. - Globally, ALT(3 cm), SH(1.3 cm + deep contribution) Difference ALT – INSITU 1993-2003 Left, 10-year trends from Morrow et al, 2007
Zonal average of altimetric height, steric height, and temperature Zonally-averaged 10-year difference 2003/5 minus 1993/5 Top: Altimetric height (blue) Thermosteric height (red, Willis-A) Thermosteric height (green, Willis-B) Bottom: Colors: Temperature diff. (Willis-A) Contours: Mean Temperature (Argo) ALT Steric More work is needed on instrument biases to understand mostly-XBT to mostly-Argo transition.
Zonal integral of altimetric height, steric height, and temperature Zonally-integrated 10-year difference 2003/5 minus 1993/5 Top: Altimetric height (blue) Thermosteric height (red, Willis-A) Thermosteric height (green, Willis-B) Bottom: Colors: Temperature diff. (Willis-A) Contours: Mean Temperature (Argo) The dominance of the Southern Hemisphere Oceans stands out in the zonally integrated quantities. The largest decadal change occurred at 40oS. ALT Zonal integral of height anomaly x 104 m2 Steric
Zonally averaged temperature change for different climatologies T(zonal avg): Argo (2004/6) minus WGHC T(zonal avg): Argo (2004/6) minus WOA01 T(zonal avg): Willis-A 2003/5 minus 1993/5 Similarity in pattern suggests decadal and multi-decadal changes are not greatly different.
Zonally averaged temperature difference by ocean basin, Argo (2004/06) minus WOA01 XY-avg of ΔT Average temperature anomaly is 0.03oC (8 x 10²² J globally) Strongest warm anomalies at 40oS, 60oN Cool anomalies (upward displacement) at 20oS, 20oN, 40oN.
Zonally averaged salinity difference by ocean basin, Argo (2004/06) minus WOA01 XY-avg of ΔS • Atlantic (0-200 m) has freshwater deficit in Argo data relative to WOA01 (.05 psu) • Pacific (0-200 m) has surplus (.01 psu). • Freshening at intermediate levels in Southern Hemisphere in all oceans. • Net freshening 0-2000 m.
Southern subtropical gyres and SAF Colors: ALT 10-yr change Contours: Argo DH 1000/2000 Colors: Argo – WGHC DH 0/2000 Contours: Argo DH 1000/2000 Colors: ALT 10-yr change Contours: SLP 10-yr change Cai (2006) “an increasing trend of the midlatitude positive curl with isopleths shifting southward, indicating an intensifying, southward-shifting subtropical gyre circulation.”
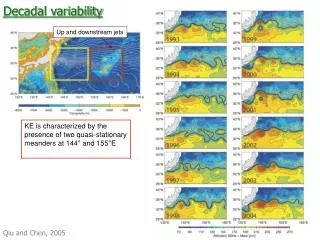
South Pacific 1000/2000 db SH Roemmich et al (2007) Comparison of Argo, ALT, WOCE, and CLIVAR repeat hydrography. Gyre acceleration was seen in all data, including float trajectories at 1000 m and temperature to 2000 m. Qiu and Chen (2006) compared ALT (upper panel) with SSH trend from a simple wind-driven model, emphasizing the importance of propagating response. SSH and 0/2000 db SH
South Pacific – Salinity Fresh anomalies in intermediate waters of the Southern Hemisphere seen in WOCE relative to earlier data (Wong et al, 1999)continue to freshen in Argo relative to WOCE. Argo minus WOA01 salinity on σθ = 26.9 Argo minus WOCE salinity on σθ = 26.9
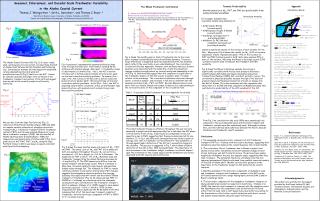
South of Australia SR3 line HRX line 1992/6 SURVOSTRAL HRX line SR3 repeat hydrography line Morrow et al, 2007 2000/4 Δ Both the High Resolution XBT transect and the SR3 repeat hydrography line showed a southward shift of the STF and SAF. In the latter, the warming was seen to 2000 m depth (Morrow, et al, 2007).
Top: Blue – ALT 10-yr diff, Red – Willis_B 10-yr diff Tropical Pacific/Indian Pacific Indian Zonal wind stress averaged over 10oN-10oS, 150oE-80oW, NCEP 60-month running mean 12-month running mean Colors: Along equator Willis_B 10-yr diff, Contours: Argo mean T .01 N/m2 A multi-decadal decrease in the Pacific tradewinds (McPhaden and Zhang, 2002) began to reverse in the most recent decade (McPhaden and Zhang, 2004). The recent 10-year signal in the ocean is a warming and downward displacement of the thermocline in the western tropical Pacific, cooling in the east. NCEP Anomaly in wind stress: 2000/2006 minus 1990/2000
Trend : -0.23 psu / 30 years Tropical Pacific surface salinity(Delcroix et al., 2007) + + - On decadal time-scale, SSS in the designated regions vary in phase(+) or out of phase (-) with the PDO. This is consistent with precipitation variability in the western, but not eastern region. + A multi-decadal trend is seen in SSS in the western warm pool region, consistent with precipitation.
North Pacific ALT, 2003/05 – 1993/95 HRX line Willis-B, SH 0/750 db: 2003/05 – 1993/95 Colors: Argo – WOA01 DH 0/2000 db Contours: Argo DH 0/2000 db
North Pacific The NPC increase is seen in ALT, broadscale and HR XBT, and Argo data. Douglass et al, 2006 Cummins and Freeland (2007) Zonal velocity at ~150oW from HR XBT
North Atlantic Pattern is similar to North Pacific. Subpolar gyre decreasing in strength (Hakkinen and Rhines, 2004) High salinity, reversing the previous decadal freshening (Hatun et al, 2005, Peterson et al, 2006) is attributed to increased input of subtropical waters. ALT, 2003/05 – 1993/95 Willis-B, SH 0/750 db: 2003/05 – 1993/95 Colors: Argo – WOA01 upper 200 m salinity anomaly Contours: Argo DH 0/2000 db
North Atlantic The first EOF dominates the 10-year change in ALT (Hakkinen and Rhines, 2004, also Fu, 2004, Greiner et al 2006) Decadal increases in surface salinity are seen in time-series in the northern Atlantic (Hatun et al, 2005), and attributed to increased input of subtropical waters.
Decadal variability in heat transport N. Atlantic MOC and heat transport, Bryden et al, 2005 Hydrographic transects in 1957, 1981, 1992, 1998, 2004. N Pacific heat budget, Douglass et al, 2007 A high priority is to observe the interannual to decadal variability in meridional ocean heat transport (Douglass et al, 2007) and overturning circulations (Bryden et al, 2005), as well as air/sea feedback in western boundary current regions (e.g. Kelly, 2004). However, a comprehensive WBC observing system is not yet in place, and historical datasets are subject to serious aliasing issues (e.g. Wunsch and Heimbach, 2006). SW Pacific heat budget, Roemmich et al, 2005
Summary (1) – Decadal ocean variability • Decadal anomalies in the wind-driven circulation are largely responsible for spatial variability of ocean heat gain. • Patterns of variability span more than one ocean basin at middle and high latitude in both hemispheres. • Decadal changes extend to depths of at least 2000 m. • In comparison of Argo salinity to WOA01, salinity increased in the upper 200 and decreased below. The Pacific became fresher and the Atlantic saltier (net transfer of freshwater). • The Southern Hemisphere dominates global decadal variability in heat and freshwater content.
Summary (2) – Ocean observations • Datasets exist for decadal variability in ocean temperature, 0 – 750 m, but attention is needed to biases in XBT data. • Southern Ocean observations are very sparse in pre-Argo times. Winter SSS (colors) and σθ(contours) from Argo • Pre-Argo salinity observations are not adequate for description of global/decadal variability. • Development of boundary current and heat transport observations is needed, as well as abyssal observations. • Climate research applications place high demands on ocean data quality, requiring .
References: Antonov, J. I., S. Levitus, and T. P. Boyer, 2002. Steric sea level variations during 1957–1994: Importance of salinity, J. Geophys. Res., 107(C12), 8013, doi:10.1029/2001JC000964. Bryden, H., H. Longworth and S. Cunningham, 2005. Slowing of the Atlantic meridional overturning circulation at 25oN, Nature, 438, 655-657. Cai, W., 2006. Antarctic ozone depletion causes an intensification of the Southern Ocean supergyre circulation, Geophys. Res. Lett., 33, L03712, doi:10.1029/2005GL024911. Conkright, M.E., R.A. Locarnini, H.E. Carcia, T.D. O’Brien, T.P. Boyer, C.Stephens, and J.I. Antonov, 2002., World Ocean Atlas 2001: Objective analyses, Data Statistics, and Figures, CD-ROM Documentation, 17pp, National Oceanographic Data Center, Silver Spring, MD. Cummins, P. and H. Freeland, 2007. Variability of the North Pacific Current and its bifurcation. Submitted to Prog. Oceanogr. Delcroix, T., S. Cravatte, and M. McPhaden, 2007. Decadal variations and trends in tropical Pacific sea surface salinity since 1970, J. Geophys. Res., In press. Douglass, E., D. Roemmich, and D. Stammer, 2006. Interannual variability in northeast Pacific circulation, J. Geophys. Res., 111, C04001, doi:10.1029/2005JC003015. Ducet N., P.-Y. Le Traon, and G. Reverdin, 2000. Global high resolution mapping of ocean circulation from TOPEX/POSEIDON and ERS-1/2, J. Geophys. Res. 105, 19477-19498. Fu, L.-L., 2004. The interannual variability of the North Atlantic Ocean revealed by combined data from TOPEX/Poseidon and Jason altimetric measurements, Geophys. Res. Lett., 31, L23303, doi:10.1029/ 2004GL021200. Gouretski V. V. and K. P. Koltermann, 2004. WOCE Global Hydrographic Climatology, A Technical Report, Berichte des Bundesamtes f¨ur Seeschifffahrt und Hydrographie, No. 35, 50pp. Greiner, E., M. Benkiran, Pergaud, 2006. The MERCATOR 1992-2002 PSY1V2 reanalysis for tropical and North Atlantic. Proceedings of the Symposium on 15 years of Progress in Radar Altimetry, 13-18 March 2006, Venice, Italy Guinehut, S., P.Y. Le Traon, G. Larnicol and S. Philipps, 2004. Combining Argo and remote-sensing data to estimate the ocean three-dimensional temperature fields – a first approach based on simulated observations. J. Mar. Sys., 46, 85-98. Hakkinen, S. and P. Rhines, 2004. Decline of subpolar North Atlantic circulation during the 1990s. Science, 304, 555-559. Hatun H., A. Sando, H. Drange, B. Hansen and H. Valdimarsson, 2005. Influence of the Atlantic subpolar gyre on the thermohaline circulation. Science, 309, 1841-1844. McPhaden, M. and D. Zhang, 2002. Slowdown of the meridional overturning circulation in the upper Pacific Ocean. Nature, 415, 603-608. McPhaden, M. J., and D. Zhang, 2004. Pacific Ocean circulation rebounds, Geophys. Res. Lett., 31, L18301, doi:10.1029/2004GL020727. Morrow, R., G. Valladeau, J-B Sallee, 2007. Observed subsurface signature of Southern Ocean sea level rise. Accepted by Prog. Oceanogr. Peterson, B., J. McClelland, R. Curry, R. Holmes, J. Walsh,and K. Aagaard, 2006. Trajectory shifts in the Arctic and Subarctic freshwater cycle. Science, 313, 1061-1066. Qiu, B., and S. M. Chen (2006), Decadal variability in the large-scale sea surface height field of the South Pacific Ocean: Observations and causes, J. Phys. Oceanogr., 36, 1751-1762. Roemmich, D., J. Gilson, R. Davis, P. Sutton, S. Wijffels, S. Riser, 2007. Decadal spin-up of the South Pacific subtropical gyre. J. Phys. Oceanogr., 37(2), 162-173. Roemmich, D., J. Gilson, J. Willis, P. Sutton, and K. Ridgway, 2005. Closing the time-varying mass and heat budgets for large ocean areas: The Tasman Box. Journal of Climate, 18 (13), 2330–2343. Willis, J.K., D. Roemmich, and B. Cornuelle, 2004. Interannual variability in upper-ocean heat content, temperature and thermosteric expansion on global scales, J. Geophys. Res., 109, C12036, doi:10.1029/2003JC002260. Wong, A., N. Bindoff, and J. Church, 1999. Large-scale freshening of intermediate waters in the Pacific and Indian Oceans. Nature, 400, 440-443. Wunsch, C. And P. Heimbach, 2006. Estimated decadal changes in the North Atlantic meridional overturning circulation and heat flux 1993–2004. J. Phys. Oceanogr., 36, 2012 – 2024.