Download
1 / 5
50 likes | 186 Vues
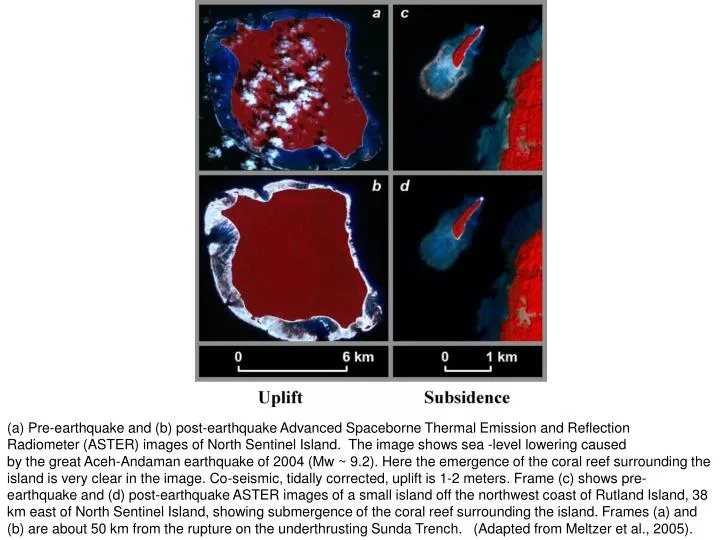
(a) Pre-earthquake and (b) post-earthquake Advanced Spaceborne Thermal Emission and Reflection Radiometer (ASTER) images of North Sentinel Island. The image shows sea -level lowering caused

E N D
(a) Pre-earthquake and (b) post-earthquake Advanced Spaceborne Thermal Emission and Reflection Radiometer (ASTER) images of North Sentinel Island. The image shows sea -level lowering caused by the great Aceh-Andaman earthquake of 2004 (Mw ~ 9.2). Here the emergence of the coral reef surrounding the island is very clear in the image. Co-seismic, tidally corrected, uplift is 1-2 meters. Frame (c) shows pre-earthquake and (d) post-earthquake ASTER images of a small island off the northwest coast of Rutland Island, 38 km east of North Sentinel Island, showing submergence of the coral reef surrounding the island. Frames (a) and (b) are about 50 km from the rupture on the underthrusting Sunda Trench. (Adapted from Meltzer et al., 2005).
Surface Mass Loading – Conclusions • Uncertainties in mantle viscosity and Late-Pleistocene ice mass histories have a significant impact on estimates of global sea level rise from tide gauge observations • Differences between current models of Antarctic and Greenland deglaciation histories are considerable and will influence interpretations of altimetry and time variable gravity data • Fingerprinting of sea level data (e.g., for polar ice melt signatures) offers promise of understanding mass balances given enhanced relative sea level (RSL) data sets • Improved constraints on RSL variations should be made in all parts of the world. These RSL data provide important feedback into all models of ice mass change and sea level mass change
Surface Mass Loading – Discussion • Improve constraints on the fingerprints associated with thermosteric effects and recent ice mass flux • Determine what other data sets can be invoked to limit the range of possible melting geometries, or to expand the range from the simple scenarios considered to date • How can the uncertainty in the GIA signal, which is still significant, be best parameterized within the fingerprint procedure? • What is the correct way to incorporate polar wander variations in the (relative) sea level predictions? • What are the important sources of noise, and which processes (e.g., terrestrial hydrological redistributions) need to be included in an expanded regression analysis? • In regard to tide gauge records, what is the appropriate balance to strike between retaining information and culling the data set to avoid systematic sources of error, and how might this data set be combined with others (e.g., GRACE and GOCE gravity) in an extended fingerprint analysis
Surface Mass Loading – Recommendations 1: Data • For offering the community better GIA constraints we need: • Continuous GPS networks as dense as feasible in the way this was done with the BIFROST project • Follow-on GRACE gravity mission for continuity of the gravity data sets and for observing temporal variations at higher resolution • Follow-on JASON mission with higher latitude coverage for ocean surfaces, notably for fingerprinting, and a dedicated altimetry mission (ICESAT follow-on, CRYOSAT) for ice mass surfaces • Continuity of tide gauges and network densification in the southern hemisphere • Extension of the relative sea level data sets from geological and archaeological indicators
Surface Mass Loading – Recommendations 2: Modelling • Concerning modelling efforts: • Truly 3D earth modelling that incorporates more realistic lateral variations in (possibly non-linear) rheologies and lithosphere for regional applications when there is a clear necessity for it (Occam’s razor) • A more reliable prediction is needed of GIA-induced True Polar Wander • Ice sheet models that are internally dynamically consistent and that are consistent with all known geological, ice-core, sedimentary-core, trimline and other data • Non-ice sheet related surface forcings (tectonic, co- and postseismic, sedimentary, hydrological, changes in ocean currents, etc.) • Standardisation for practical purposes with clear instructions on how to use them (e.g. valid for global applications but not for regional ones)