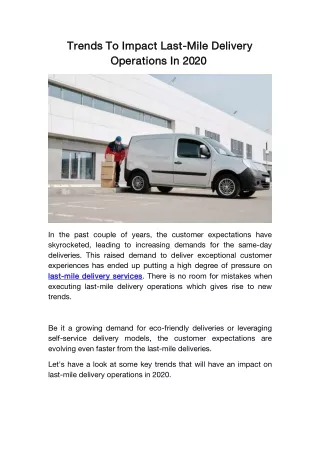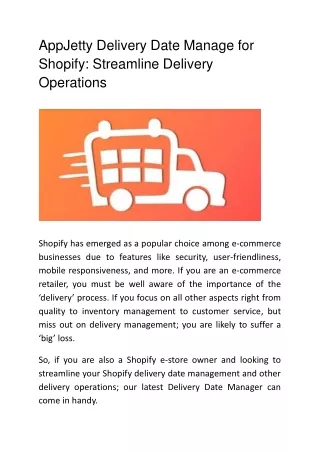
Delivery Operations
Delivery Operations. Joint Area Vice Presidents; Managers, Operations Support; Area Marketing Managers Meeting September 11, 2008. Reduce Route Structure. 12.7. $530. Fall / Spring Adjustments. Continuous Improvement. Collection Standardization. 8.1. $300.

Delivery Operations
E N D
Presentation Transcript
Delivery Operations Joint Area Vice Presidents; Managers, Operations Support; Area Marketing Managers Meeting September 11, 2008
Reduce Route Structure 12.7 $530 Fall / Spring Adjustments Continuous Improvement Collection Standardization 8.1 $300 Maintain Hours per Rt 0.7 $25 Reduce Dedicated Coll Rts Function 2B 21.5 $855 Rural Mail Count Annualization 3.7 $115 Rural DPS at 85% 1.0 $30 Function 2A 4.7 $145 Total Savings 26.2 $1,000 2009 F-2 Challenge FUNCTION 2 CLOSING THE GAP STRATEGIES (millions) Workhours Dollars
Continuous Improvement Drive Major Delivery Efficiency Components FY 2009 CDPOM Productivity Expectations % Standard at Demonstrated Performance % Adjusted Street Base at 98% DPS at 90% Eliminate Two Costly Paradigms Fall Mailing Season (Sep thru Nov) Opportunity December (Christmas) Opportunity Strategy / Tactics Strategies/Tactics – Qtr 1 FY 2009 Result - Maintain Current Hours per Route Performance in Qtr 1 - $300 million
Continuous Improvement Office 100% Standard FY 2007 Qtr 3 . . . Street 100% Street Base DPS % 85% Office 97% Standard FY 2008 Qtr 1 . . . Street 100% Street Base DPS % 89% 90% Standard – Current Nat’l Demonstrated Performance in DOIS Office Street DPS % 90% Standard 98% Street Base 90% Office 97% Standard 4 of 9 Areas Currently Achieving Aligns CDPOM with DOIS Daily Projections FY 2009 Qtr 1 . . . FY 2008 Qtr 4 . . . Street 98% Street Base 90% DPS – FY 2009 Budget Target DPS % 89% Office 90% Standard 98% Adjusted Street Base – 5 Areas Achieving in Qtr 4 FY 2009 Qtr 1 . . . Street 98% Street Base DPS % 90% Standardized, Proactive Scheduling/Staffing Tool has Helped to Drive Continuous Improvement In Delivery Efficiency CDPOM Productivity Expectations:
Continuous Improvement Area Distribution Based On Current Expectations Area Distribution Based On Revised Expectations Pivot Opportunity % Achieved Pivot Opportunity % Achieved Week 48 Gap 179KWorkhours Week 48 Gap 96KWorkhours National Week 48 CDPOM Efficiency at FY 2009 Performance Expectations Week 48 CDPOM Efficiency at Current Performance Expectations
IMPACT OF FALL MAILING SEASON Average Weekly Rate of Change – May-Aug vs Sep-Nov Avg Sep - Nov 200 180 160 1,140,294,866 140 Average Daily Impact Per Rt 22 Min 120 Avg Sep - Nov Avg May-Aug 100 Cased Volume (millions) 976,834,805 957,285,386 Avg May-Aug 80 Average Daily Impact Per Rt 16 Min Avg Sep - Nov 848,028,815 60 800,000 Avg May-Aug 40 750,334,448 Average Daily Impact Per Rt 6 Min 20 700,000 697,219,161 * 2008-2009 2006-2007 2007-2008 19% 15% 8% Rate of Change 30 31 32 33 34 35 36 37 38 39 40 41 42 43 44 45 46 47 48 49 50 51 52 53 02 03 04 05 06 07 08 09 10 183 M 129 M 53 M Amount of Change * Projected FY 2006-07 FY 2007-08 FY 2008-09 Eliminate Costly Paradigms Fall Mailing Season Impact on Average Cased Volumes 1,400,000 Summer Fall 2007 - 2008 Summer Fall 2006 - 2007 Summer Fall 2008 – 2009 1,300,000 * 1,200,000 1,100,000 1,000,000 Cased Volume (000) 900,000 600,000 500,000 400,000 May June July August September October November * Projected
Hours per Route Result: Maintain Current Route Coverage in Qtr 1
Hours per Route Tactic: Maintain Current Route Coverage in Qtr 1 (LDC 23/27)
Eliminate Costly Paradigms Tactic: Manage to Actual Workload During December
Eliminate Costly Paradigms Tactic: Manage to Actual Workload During Dec (LDC 23/27)
WORKHOUR DOLLARS Qtr 1, FY 2009 SAVINGS SAVINGS 4,858,251 $179,755,299 DELIVERY ROUTES OCT-NOV 224,632 $8,311,369 LDC 23/27 OCT-NOV 2,543,895 $94,124,130 DELIVERY ROUTES DECEMBER 504,406 $18,663,014 LDC 23/27 DECEMBER TOTAL SAVINGS POTENTIAL 8,131,184 $300,853,812 Savings Summary QTR 1 OPPORTUNITY – MAINTAIN CURRENT HRS per RT
2009 Rt Structure 2009 Route Structure
* Assumes that Routes are Eliminated Day 1, FY 2009 2009 Rt Structure Plan Supported Routes – FY 2008 vs FY 2009
Conduct Fall Route Inspections / Minor Rt Adjustments Execute the Strategy: MRA Where Current Rt Inspection Data Exists – Using COR Full RCI Focus on Inner City Low Volume Units Continuous Vacant/Opportunity Route Reviews Negotiated Minors District Manager Route Reduction Targets Aggressive Spring Route Inspection / MRAs Casers and Deliverers Concept Strategy / Tactics Strategies/Tactics - FY 2009 Route Structure
Fall Readiness Fall Targeted Route Inspection Tracking Report
DM Targets ESTABLISH DISTRICT MANAGER ROUTE REDUCTION TARGETS FALL RT ADJUSTMENT SAVINGS POTENTIAL AT 1 ROUTE IN 20+ ROUTE UNITS
DM Targets ESTABLISH DISTRICT MANAGER ROUTE REDUCTION TARGETS FALL RT ADJUSTMENT SAVINGS POTENTIAL AT 1 ROUTE IN 20+ ROUTE UNITS
2009 Rt Adjustments CAPTURE SAVINGS Fall 2009 Savings Potential Based on 3,750 DM Target OCT NOV DEC JAN FEB MAR APR MAY JUN JUL AUG SEP FY 2009 6.8 mill Fall 0 0 0 750 720 780 780 780 750 750 780 780 2009 Route Adjustment Timeline Fall Adjustments CONDUCT OCT NOV DEC JAN FEB MAR APR MAY JUN JUL AUG SEP QTR 1 QTR 2 QTR 3 QTR 4
Traditional Processes – Execute the Strategy MRA Where Current Rt Inspection Data Exists – Using COR Targeted Full Route Count & Inspections Continuous Vacant/Opportunity Route Reviews Negotiated Minors Allows Across the Board Minor Adjustments for Volume Reductions Plus COR Usage Pursue Nat’l Union Negotiations (from a position of strength) Spring Route Inspection / MRAs Aggressive Potential Article 19 Eliminating the Requirement for: Current Route Inspection Data Same Carrier on Route Strategy / Tactics Strategies/Tactics - FY 2009 Route Structure
2009 Rt Adjustments CAPTURE SAVINGS Fall Adjustments CONDUCT CAPTURE SAVINGS Spring 2009 Savings Potential Based on 6,300 Required Target OCT NOV DEC JAN FEB MAR APR MAY JUN JUL AUG SEP FY 2009 6.8 mill Fall 0 0 0 750 720 780 780 780 750 750 780 780 5.9 mill Spring 0 0 0 0 0 0 0 0 1,446 1,446 1,504 1,504 12.7 mill Total 0 0 0 750 720 780 780 780 2,196 2,196 2,284 2,284 2009 Route Adjustment Timeline Spring Adjustments CONDUCT OCT NOV DEC JAN FEB MAR APR MAY JUN JUL AUG SEP QTR 1 QTR 2 QTR 3 QTR 4
2009 Rt Adjustments Casers and Deliverers Concept
Casers / Deliverers Recorded Volumes Discounted by 20% to Account for Inflation
Casers / Deliverers Current Situation Significant Number (16%) of Units Average Less Than 3ft Cased Volume a Day (Based on May 2008) Carriers expand office time to justify leaving time Low, incremental volumes cause waiting time impacts felt on every route Average FOT costs have increased to 39.33 minutes nationally Current Annualized Cost of FOT - $1.2 billion Result - Inefficient route structure and vehicle utilization
Example: Value of Cased Workload Value of Fixed Office Time 30 route office casing an average of 2.5 ft of mail daily and achieving 100% Standard 20.0 hours 19.7 hours 39.7 hours Total Earned Daily Office Time Casers / Deliverers Current Situation Many inner city, low volume units earn more in Fixed Office Time than the value of their cased workload • Due to : • Expansion of office time • Carrier waiting time / mail flow Issues Actual % Standard performance degrades to avg of 150% standard in low volume units 60.0 hours Total Actual Daily Office Time Result: Traditional 2 hours in the office and 6 on the street!
Casers / Deliverers Suggested Unit Criteria for Implementation 3 Feet or Less Cased Volume per Route Poor Percent to Standard Current Vacant Routes or Potential Vacant Routes Current Street Times Greater than 6:30 Consistent Mail Flow from Processing Mail Arrival (to meet 3 hour casing window, 9:30 AM leave time)
Casers / Deliverers SAMPLE CANDIDATE OFFICES
Casers / Deliverers Solution – Decouple Office / Street Duties Proposed Strategy Evaluate Routes and make Adjustments by Removing Casing / Office Duties from as Many Routes as Possible Creating Separate Caser and Deliverer Assignments Street Routes – 100% Street Delivery Caser Routes– Office and Street Delivery Existing RC&I or Minor Adjustment Process 141.19 requires reasonably current data and same carrier Local agreed upon process
Casers / Deliverers Solution – Decouple Office / Street Duties Proposed Strategy – Creation of 100% Street Routes Remove all office time except clocking in, sign for keys, accountables, obtain scanner, receive instruction/service talks, vehicle safety check. Add street time to the route approximately equal to amount of office time removed (as near to 8 hours as possible) Carrier collects mail prepared and staged for street delivery, collects accountables, clocks to the street, loads vehicle and proceeds to the first delivery point Expectation that carrier street time will be about 7:40 hours for deliverers
Casers / Deliverers Suggested Implementation Perform a Route Inspection on the Unit Determine the Office Time value for the Unit Using Unit Office Time determine the number of casers required (Total office time / 2:45) Determine the Street Time value for the Unit Determine the Street Time required to make the Casers 8 hours (Total street time - Casers * 4:30) With Remaining Street Time determine how many Deliverers are needed (Remaining street time / 7:40) Create New Assignments in COR
Casers / Deliverers Benefits Over Current Traditional Rt Structure Reduction of required unit level Fixed Office Time Reduction of idle waiting time due to low incremental volumes on multiple trips Less contention over the value of the workload with individual carriers More consistent delivery times
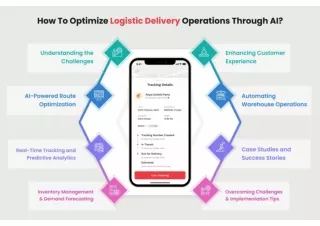
Street Management Tools New Tools for Effective Street Management GPS/GIS Delivery Point Coverage Daily Report
Street Management Tools Global Positioning System/Global Information System • Currently installed in 500 vehicles with passive GPS/GIS system in Chicago • Requires no interaction with carrier • GPS makes it possible to easily locate and account for USPS delivery vehicles • Simply records information • Miles traveled • Deviations from route • Idle time • With engine on and with engine off • Number of stops and park points • Deviation from route structure (hop and stop vs. park and loop) • Provides breadcrumb trail of vehicle activity
Cost Breakdown: Unit cost = $252 ea 500 $126,000 Installation = $50 ea 500 $25,000 Training $2,000 Monthly Service $22.95 ea 500 $11,475 Total Annual Cost $138,000 Street Management Tools COST OF CURRENT SYSTEM UTILIZED IN CHICAGO Annual Cost Breakeven Point - 1.4 minutes per route per day!
Street Management Tools Daily Delivery Coverage • Objective: Identify Estimated Daily Delivery Point Coverage through Automation Equipment Compare Against a Route’s Base Delivery Coverage Generate a Daily Report for AM Supervisor to Review and Consider When Determining Street Expectations • Next Steps: Currently Completing Initial Coding Requirements Pilot Site Testing to Begin Over the Next Several Weeks National Deployment Qtr 2 FY09
Street Management Tools 0 – 65% Coverage 65 – 85% Coverage > Than 85% Coverage Daily Delivery Point Coverage Report
Street Management Tools Daily Delivery Point Coverage Report Area Rollup * Non Validated Data
We Face an Unprecedented Budget Challenge in FY 2009 with 6,300 Unfunded Routes on Day 1 Every Day we Wait in Reducing Routes Adds to the 2009 Reduction Requirement. Execute the Strategy with: Aggressive Fall/Spring Inspection/MRA Plans Accountability – District Manager Route Reduction Targets Fall Mailing Season Opportunity Christmas Opportunity Effective Use of Scheduling / Staffing Tools Achievement of Continuous Improvement Targets While We Won’t Realize Substantial Savings from Route Reductions in Qtr 1, we Have a Huge Opportunity in Maintaining our Current Hours per Route Through December Eliminate the Paradigms and Manage to Actual Workload To the Extent we are Unsuccessful in Reducing the # Routes Needed to Achieve Budget, We Will Need to Close the Gap By: Continued and Deeper Levels of Pivoting Through: Summary