Download
1 / 13
130 likes | 154 Vues
Explore the hydrologic cycle distribution on Earth, Mesopotamian wetlands, water withdrawals, and global agricultural trends. Understand the impacts of population growth and climate change on water resources.

E N D
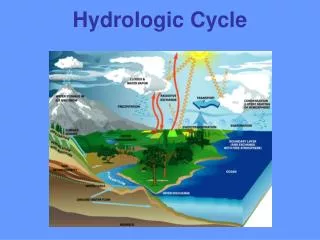
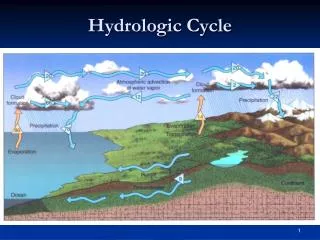
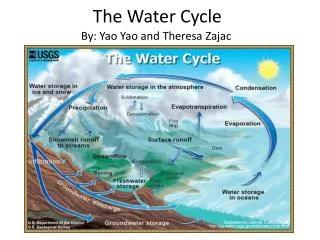
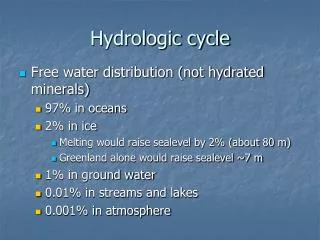
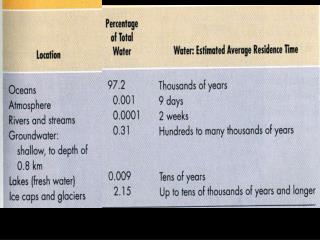
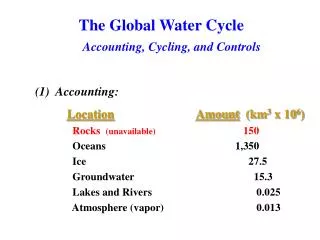
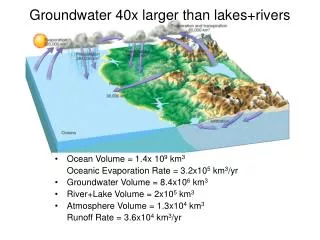
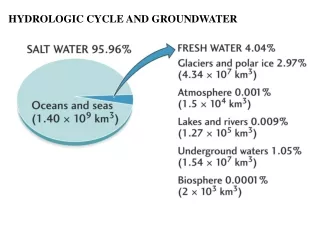
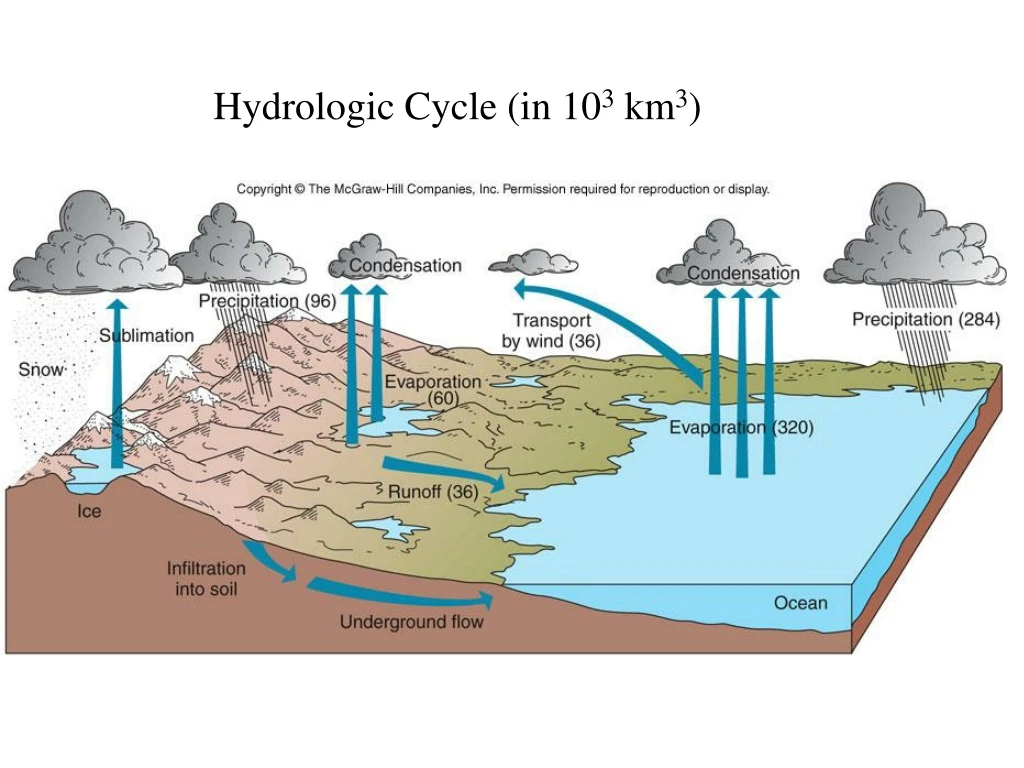
Distribution on Earth “Water, water everywhere, nor any drop to drink.” – Coleridge, Rime of the Ancient Mariner
Mesopotamian Wetlands - 2000 From http://www.un.org/Pubs/chronicle/2002/issue2/0202p44_mesopotamian_marshlands.html
Fig. 1 (A) Trends in annual rates of application of nitrogenous fertilizer (N), and of phosphate (P) for all nations, except former USSR. (B) Trends in global area of land in pasture or crops. (C) Trend in global pesticide production per year. (D) Trend in expeditures on pesticide imports summed across all nations, transformed to constant 1996 USD. All trends are as dependent on global population and GDP as on time. [From Forecasting Agriculturally Driven Global Environmental Change, D.Tilman et al., 2001, Science, Vol.292, pg. 281-284]
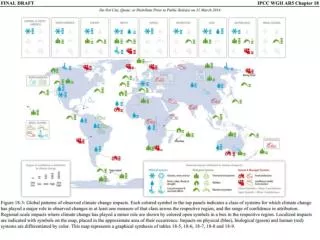
Fig. 1) Global distribution of population in 1985 with respect to relative water stress threshold of DIA/Q = 0.4 indicating severe water scarcity. A 30’ resolution is used for this map. Mapping reflects a mean global runoff of ~40,000 km3/year and aggregate water withdrawals of 3100 km3/year. These estimates are highly dependent on contemporary water use statistics, which reflect a degree of uncertainty (e.g., assessments made in 1987 vary > 1300 km3/year). Use with caution. [From Global Water Resources: Vulnerability from Climate Change and Population Growth, 2000, C.J. Vorosmarty et al., Science, Vol. 289, pg. 284-288]