Download
1 / 62
911 likes | 3.56k Vues
No Doze EEG Sleep Detector. Ben Schneider David Mahr Kuang Hau Tan. ECE 445 Senior Design Nov 30, 2006 Project #9. Introduction. Our sleep detector serves as a life saving device that will alert drivers that are drowsy or have fallen asleep

E N D
No Doze EEG Sleep Detector Ben Schneider David Mahr Kuang Hau Tan ECE 445 Senior Design Nov 30, 2006 Project #9
Introduction • Our sleep detector serves as a life saving device that will alert drivers that are drowsy or have fallen asleep • No effective sleep detector for drivers is currently available • Drowsiness contributes to 1,000,000 crashes annually (1/6 of all car accidents) • 1,500 fatalities • 71,000 injuries • $12.5 billion
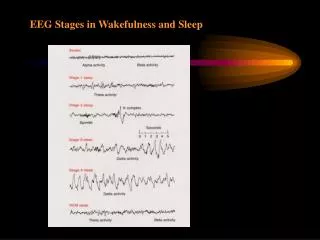
Introduction • EEG collects brainwaves by measuring voltage differentials across scalp • Brain waves vary in frequency and amplitude • Categorized base on waveform as alpha, beta, delta, and theta waves • Type of wave (frequency of waveform) is indicative of a person’s awareness level • Beta waves → person is awake and alert (>12Hz) • Alpha waves → onset of sleep (8–12 Hz) • Theta waves → light sleep (4–8 Hz) • Delta waves → deep sleep (1–4 Hz) • Our device uses the frequency of EEG signal to determine the alertness level of user and to diagnose sleep
Device Features • Alerts user in less than a second after sleep onset • Only 3 electrodes needed • 3 alarm volume levels (increasing with time asleep) • Portable (uses non-propriety battery) • Wireless connection to base unit • Visual and audio alerts
System Overview • Block diagram
Our Device Base Alarm Unit Head Gear Unit
System Overview (cont.) Signal Conditioning Wireless Module Buzzer Audio Module EEG Sensor LED Logic Base Alarm Unit Head Gear Unit
Hardware Overview • EEG sensor circuit • Measures brainwaves • Filters and amplifies signal • Signal Processing • Detects frequency of EEG signal • Controls buzzer and LED awareness bar • Wireless Module • Relays PIC outputs to LED circuit
Hardware Overview (cont.) • LED Awareness Bar • Color reflects user of current alertness level • Audio Module • Start up melody • Constant melody during low awareness state • Alarm signal during sleep • Buzzer Circuit • Alerts sleeping user • 3 Volume levels
Purpose • Amplify brainwaves a sufficient amount in order to be read by PIC. • Maintain favorable SNR ratio throughout amplification process. • Account for DC offset and excess noise throughout circuit through use of analog filters.
Challenges • Brainwaves are on the order of 10uV • Requires a large amount of gain • Greater gain = Greater noise • Power line interference (60Hz) • DC offset amplification (Dipole in Eyes, Shift of wires) • Single Channel EEG • Most EEG use multiple channels and surround entire head with electrodes • In interest of simplicity and convenience of user, we wish to use least amount of electrodes and wires as possible
Instrumentation Amplifier • A type of differential amplifier used to amplify the difference between two input signals. • Voltage differences between inputs are amplified and sent to the output • Similarities on inputs are rejected and attenuated. • Important characteristics • High Common-Mode Rejection ratio (CMRR) • Low DC offset • Low Drift • Low Noise
Gain • Desire range of 1 Vpp to be processed by PIC • Because brainwaves measured on the scalp are on the order of 10uV, we choose to amplify by a gain of 121,825. • Max gain of each instrumentation amplifier is 10,000. • Use two in series (G1=4941,G2=24.656)
Gain • 1st I. Amp • Rg=10 Ohms • G=4941 • 2nd I. Amp • Rg=3.3k || 5.1k =2003.57 Ohms • G2=24.656
Common-mode Rejection Ratio(CMRR) Ad=Differential Gain Ac=Common-mode Gain • Measures tendency of the device to reject input signals common to both input leads. • High CMRR is very important when measuring very small voltage differentials • To Test This… • Look at output when inputs are shorted to determine common-mode gain. • Examine gain of a test signal to determine differential gain
1st Instrumentation Amplifier • Input signal: 20Hz, .001V • Output: 20Hz, 4.930V • Common-mode Gain: 200mV • Theoretical Gain: 4941 • Actual Gain: 4930 • CMRR 87.83dB
2nd Instrumentation Amplifier • Input signal: 20Hz, .1V • Output: 20Hz, 2.75V • Common-mode Gain: <<.01mV • Theoretical Gain: 24.656 • Actual Gain: 27.5 • CMRR >>200dB
Filters • Active vs. Passive Filters • Sharper cut-offs • Less subject to feedback, act as buffer • Respond quicker to spontaneous DC offsets
Passive High-pass Filters • Cutoff frequency of .34Hz • Used before instrumentation amplifiers Simulation Actual
Active Low-pass Filters • Cutoff frequency of 2.34Hz • Used after instrumentation amplifiers Simulation Actual
Active 6th Order Low-pass Filter • I.C. manufactured by National Semiconductor • Cutoff Frequency of 39.44Hz • Used immediately before sending signal to PIC Simulation Actual
Active Low-pass and High-pass in Series Simulation Actual
EEG Data • Adjusted oscilloscope to 50s/div (500sec=8.33 Min) • Imported scope data into Matlab • Calculated average frequency every 5 sec.
Purpose of Module • Determine the awareness of the user and output accordingly to other modules • Accomplished through finding the frequency of the EEG signal • > 12 Hz → High Alertness • > 8Hz & < 12 Hz → Low Awareness • < 8 Hz → Sleeping
Algorithm I • Determine the average offset of the EEG signal (over 256 ms) • Sum all data points and then right shift by 8 bits • Count the number of zero crossings • New ADC value > average offset and old ADC < average offset (or vice versa) then zero crossing has occurred • Frequency = number of zero crossings (since over 500 ms) • Problems: • Variation in output near threshold frequencies • EEG signal must be offset so that all points are greater than zero but less than 5 V • Voltage spikes throw off average value
Algorithm II • Eliminate DC offset in EEG circuit and rectify input to the PIC • Determine the number of positive peaks that occur (over 500 ms) • If ADC (t) < ADC (t+1) > ADC (t+2), peak has occurred • Frequency = 2*(number of peaks) • Problems: • Noise introduces positive peaks that are not a part of the frequency count • PIC perceives a frequency higher than the true value
Algorithm III • Determine the number of falling edges in rectified EEG signal (over 500 ms) • Old ADC > 0 and New ADC = 0 • Frequency = 2*(number of falling edges) • Sampling rate increased to reduce indecision at transition frequencies • (40 samples/s → 125 samples/s) • Problems: • Noise can introduce additional zeroes at low frequency • Not a problem if the signal is properly amplified
Control of LED Awareness Bar and Buzzer Circuit: • Transmitter Power and Sleep Indicator • Signals LED Bar when a change in awareness level occurs • ↑ Awareness level → T.P. & S.I. high • ↓ Awareness level → T.P. high & S.I. low • Buzzer 0 and Buzzer 1 • Non-sleeping user → no alarm necessary • Buzzer 0 and Buzzer 1 low • Sleeping user → need to sound alarm • Progression of Buzzer 0 and Buzzer 1 outputs separated by 1.5 seconds (01→10→11)
Volume Level • Alarms user in progressively increasing volume (3 levels) • Volume graded through the voltage supplied to the buzzer • Levels separated through use of a voltage divider • Inputs from PIC select the volume of buzzer • Increases in volume every 1.5 seconds until maximum volume is reached
Wireless Module • Components: - HP3 LINX RF pair - LM 555 - Max 232 Receiver LM555 MAX 232 Transmitter
Wireless Module HP3 LINX RF Pair • 902-928MHz band, FM/FSK Modulation,15 ft range • Outputs Sleep Indicator (DATA) and Transmitter Power (RSSI) MAX 232 • Modifies Sleep Indicator and Transmitter Power • Produces Level 5V LM555 • Modifies Transmitter Power into usable clock flag • Produces delay of 12ms.
Clock Flag To PIC 1 Pin 38 (Sleep Indicator) To LED circuit (Sleep Indicator) To PIC 1 Pin 37 (Power Down) Clock Flag Sleep Indicator 10K Ω To D-Flip-Flop (Clock Flag) 1µF
LED Logic Circuit • Consists of OR,AND,NAND and D-FlipFlops and LEDs D-Flip Flop OR gates LED Indicator AND gates NAND gates
LED Logic Circuit • 2 D-FlipFlop control leads to LED (Yellow/Red) • 3 Color LED (combination of 2 leads), Orange is made from Yellow and Red LED Color Status
K-map equation LED Logic Circuit • Legend
5V From Yellow LED Lead 5V From Red LED Lead To PIC 2 (Pin34) 74F08PC SN74LS74AN To Yellow LED Lead To Red LED Lead 5V 5V Clock Flag (from LM555) SN74LS32N SN74F00N Sleep indicator (from MAX232)
Audio Module • PIC, Oscillator and LM386N LM 386N PIC16F877A Oscillator
VS 5MHz Oscillator VS VS From PIC Pin 35 From Red LED Lead 1µF PIC 16F877A 1KΩ PIN36 VS PIN35 5100Ω PIN10 PIN34 From Output of LED Logic PIN11 PIN33 VS PIN12 PIN32
Audio Module • Initially inspired by the Theremin instrument • Sound is generated via the PIC by simulating square waveforms with frequency from 0.1KHz to 2KHz • By creating delays in the PIC, the pitch, length of tone and quality of tone can be changed • 3 Melodies: Start up, Warning, Danger Increasing & Decreasing Frequency, Continuous Variable Frequency, Discrete with delays
Flow Chart Of Events Wireless Module Transmission Power Sleep Indicator MAX 232 Transmission Power Sleep Indicator LED Status Yellow/ Orange/ Red LM555 LED Logic Circuit Clock Flag LED status LED Audio Module Yes/No? Warning/ Danger Speaker
Testing and Results • Wireless • Voltage Levels of Sleep Indicator and Transmitter Power • Timing of Incoming data (Oscilloscope) • Evaluating Noise range and Power Up time (10ms + 1.5ms) • Led Logic Circuit • Testing K-map and on-off voltage level (4.3V vs 0.05V) • Integration with Wireless Module (Oscilloscope) • Testing LED on-off voltage level (1.7V vs 1.5V) • Audio • Creating Melodies (Algorithm for Melody) • Eliminating Hum and Hisses