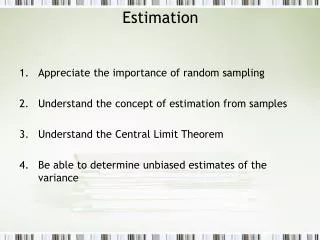
Estimation Perspectives
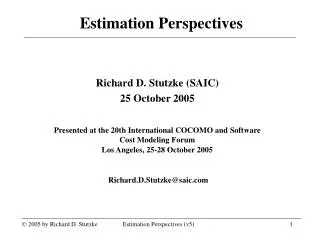
Estimation Perspectives. Richard D. Stutzke (SAIC) 25 October 2005 Presented at the 20th International COCOMO and Software Cost Modeling Forum Los Angeles, 25-28 October 2005 Richard.D.Stutzke@saic.com. Topics. Measurement and Estimation Product Size Project Cost and Schedule

Estimation Perspectives
E N D
Presentation Transcript
Estimation Perspectives Richard D. Stutzke (SAIC) 25 October 2005 Presented at the 20th International COCOMO and Software Cost Modeling Forum Los Angeles, 25-28 October 2005 Richard.D.Stutzke@saic.com Estimation Perspectives (v5)
Topics • Measurement and Estimation • Product Size • Project Cost and Schedule • Product Performance • Product Quality • Process Performance • Summary Estimation Perspectives (v5)
Reasons to Estimate and Measure • Product Size, Performance, and Quality • Evaluate feasibility of requirements • Analyze alternate product designs • Determine the required capacity and speed of hardware components • Evaluate product performance (accuracy, speed, reliability, availability) • Quantify resources needed to develop, deploy, and support a product • Identify and assess technical risks • Provide technical baselines for tracking and controlling • Project Effort, Cost and Schedule • Determine project feasibility in terms of cost and time • Identify and assess project risks • Negotiate achievable commitments • Prepare realistic plans and budgets • Evaluate business value (cost versus benefit) • Provide cost and schedule baselines for tracking and controlling • Process Capability and Performance • Predict resource consumption and efficiency • Establish norms for expected performance • Identify opportunities for improvement Estimation Perspectives (v5)
Estimation Uncertainty Typically Decreases with Time Estimation Perspectives (v5)
Total Estimation Life Cycle Estimation Perspectives (v5)
Ways to Improve Estimation Accuracy Estimation Perspectives (v5)
Quantities of Interest • Products and Services Delivered • Size or amount (created, modified, purchased) • Performance (capacity, accuracy, speed, response time) • Quality (conformance to requirements, dependability) • Price and total ownership cost • Project • Effort (activities) • Staff (number, skill and experience, turnover) • Time (phases, schedule milestones) • Effort (direct and indirect) • Costs (labor and non-labor) • Computer resources used for development and test • Process • Effectiveness • Efficiency • Flexibility Estimation Perspectives (v5)
Common Challenges • Identifying the key factors that affect the quantity of interest • Defining precise measures • Operational definitions • Affordable • Appropriate scale ([Stevens, 1948], [Zuse, 1997] • Quantifying the influence of the key factors (valid models) • The “object” evolves during development • “Object” can be the product, project, or process • The final object is not the one initially conceived Estimation Perspectives (v5)
Product Size Estimation Perspectives (v5)
Labor Dominates Software Project Cost • The concept: Effort [phrs] = Size [SLOC] / Productivity [SLOC/phr]* • The challenges • Choice and definition of the size measure • Defining productivity • Identifying all the pieces *Productivity (product size) / (resources expended) Estimation Perspectives (v5)
Physical Architecture for a Monitoring Application Sensors Front End Mainframe Display Device Drivers Polling Logic Comm. Mgt. Executive (Control Logic) Algorithms - Data Validation - Data Smoothing - Trend Analysis Data Management Comm. Mgt. Report Generator GUI Services Comm. Mgt. Display Gen. GUI Services Estimation Perspectives (v5)
Software Architecture for a Monitoring Application Software Product Data Acquisition - Device Drivers - Polling Logic(?) - Data Validation(?) - Units Conversion (scaling, clipping) Report Generation - Report Generation - Display Generation Tooling - Emulators - Stubs - Test Drivers - Test Data Preparation - Test Data Analysis - Scripts System Services - Communications Mgt. - Math and Statistics (e.g., LSQ fitting) - GUI Services - Data management (RDBMS) Data Analysis - Data Validation(?) - Data Smoothing - Trend Analysis (threshold detect) Control - Executive - Polling Logic(?) - Self-test - Data Archiving *The items followed by “(?)” may be allocated different areas depending on various considerations. Estimation Perspectives (v5)
Productivity Is Slippery • Common Issues • What is being counted? (new, modified, prototypes, tooling, breakage) • How is size defined? (Example: a line of source code) • What activities and phase are covered? (CM? QA? RA? I&T?) • How formal is the process? (reviews, documentation) • How skilled is the staff? • How many person-hours per person-month? (overtime, days off) • Specific Challenges • Software (all components unique, “exceptional” functions overlooked) • Hardware (components and assemblies) • Services (installation, training) • Documents (original, copies) Estimation Perspectives (v5)
Migration of Reused Code to the “Dark Side” Estimation Perspectives (v5)
Project Cost and Schedule Estimation Perspectives (v5)
The Precursors of Estimation • Customer’s needs and operational environment • Products and services to be delivered • Production process to be used • Project goals and constraints • Estimate’s purpose and constraints • Applicable estimating techniques and tools Estimation Perspectives (v5)
Contract Contract SOW SOW Master Schedule Master Schedule CLINs CLINs Production Production Product Product Technical Technical Spec Spec Spec TPM TPM Analyze Analyze ______ ______ Process Process Architecture Architecture Baseline Baseline Design Design ______ ______ _________________ _________________ Code Code _________________ _________________ ______ ______ _________________ _________________ Test Test Review Review Deliver Deliver Cost Baseline Cost Baseline WBS WBS WBS 1.0 ____ $ 1.0 ____ $ Earned Value Earned Value Earned Value 1.1 ____ $ 1.1 ____ $ Plan Plan Plan 1.2 ____ $ 1.2 ____ $ 2.0 ____ $ 2.0 ____ $ (Work (Work (Work BCWS $ $ $ $ BCWS $ $ $ $ BCWS $ $ $ $ Packages) Packages) Packages) BCWP $ $ $ $ BCWP $ $ $ $ BCWP $ $ $ $ ACWP $ $ $ $ ACWP $ $ $ $ ACWP $ $ $ $ Resource Loaded Resource Loaded Schedule Baseline Schedule Baseline Schedule Baseline Network Network Actuals Planning Planning Tracking Tracking Project Information Flow Project Data Engineering Data Procurement Data Estimation Perspectives (v5)
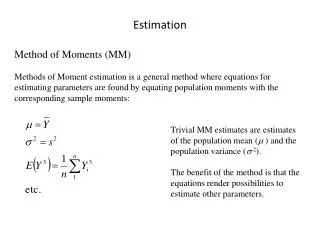
Estimating Techniques* • Expert Judgment (Delphi or PERT) • Analogy (“nearest neighbors”) • Scaling (additive, multiplicative) • Top-Down • Bottom-Up • Parametric Models *See comparison in Chapter 22 of [Boehm, 1981]. Estimation Perspectives (v5)
Usage of Estimating Techniques Changes Estimation Perspectives (v5)
Product Performance Estimation Perspectives (v5)
Reasons to Estimate Product Performance • Evaluate feasibility of specified performance • Establish bounds on expected performance • Identify type and amount of computer resources needed • “Capacity planning” • System sizing • Identify significant design parameters • Provide information when cannot measure • Product not yet built • Product is inaccessible (e.g., 24 x 7 x 52) • Measurement is too dangerous or expensive Estimation Perspectives (v5)
Typical TPMs for Computer Systems Estimation Perspectives (v5)
Actual Operational Profile Software Algorithms Assumed Operational Profile Actual Resource Usage Platform Capacity and Configuration Estimated Resource Usage Actual System Performance Estimated System Performance Hardware Costs Mission Success User Acceptance Resource Usage versus System Performance Estimation Perspectives (v5)
Estimation and Measurement Challenges Estimation Perspectives (v5)
Possible Performance Analysis Techniques • Order of magnitude calculations • Analytic model • Simple queueing results • Bottleneck analysis • Semi-analytic models (e.g., PDQ by Gunther) • Queueing network models • Simulation models • Smart stubs • Benchmark runs on similar system • Measurement of actual system Estimation Perspectives (v5)
Comparison of Options Estimation Perspectives (v5)
START START START Assess Assess Assess performance risk performance risk performance risk Identify critical Identify critical Identify critical use cases use cases use cases Select key Select key Select key Modify/create Modify/create Modify/create performance scenarios performance scenarios performance scenarios scenarios scenarios scenarios Define quantitative Define quantitative Define quantitative performance objectives performance objectives performance objectives Construct Construct Construct performance performance performance model(s model(s model(s ) ) ) Verify and validate Verify and validate Verify and validate models models models Run and evaluate Run and evaluate Run and evaluate performance performance performance model(s model(s model(s ) ) ) feasible feasible Modify product Modify product Modify product Revise performance Revise performance Revise performance Next Iteration Next Iteration Next Iteration architecture and design architecture and design architecture and design objectives objectives objectives Acceptable Acceptable Unacceptable Unacceptable performance performance performance performance infeasible infeasible *Adapted from Figure 2-1 in [Smith, 2002]. Used with permission. Performance Estimation is a Cyclic Process Estimation Perspectives (v5)
Product Quality Estimation Perspectives (v5)
Quality Factors Vary by System and Stakeholder Estimation Perspectives (v5)
Example: Product Dependability Functional Test Cases Integrated Software Assumed Operational Profile Installed and Configured Software Actual Operational Profile Actual Dependability Observed Correctness Test Platform Estimated Dependability Operational Platform User Acceptance Estimation Perspectives (v5)
Estimating Challenges Estimation Perspectives (v5)
Testing (Measurement) Challenges Estimation Perspectives (v5)
Comparison of Options *Dependability is most objective and mature. Customer preference is subjective. Estimation Perspectives (v5)
Determining Product Dependability Estimation Perspectives (v5)
Process Performance Estimation Perspectives (v5)
Process Control: Measurements + Models Estimation Perspectives (v5)
Measuring Process Performance • Key Questions • What is the current performance? • Is this value "good"? • Is it changing? • How can I make the value “better”? • Candidate Attributes* • Definition (completeness, compatibility) • Usage (compliance, consistency) • Stability (repeatability, variability) • Effectiveness (capability) • Efficiency (productivity, affordability) • Predictive Ability (accuracy, effects of tailoring and improvements) *Motivated by [Florac, 1999, Section 2.4] Estimation Perspectives (v5)
Some Examples Estimation Perspectives (v5)
Types of Process Performance Models Estimation Perspectives (v5)
Comparison of Options Estimation Perspectives (v5)
Factors Affecting Predictive Accuracy • The process definition • Detail • Stability • Tailoring • The process execution • Compliance • Consistency • The model’s scope, and validity • Relevant factors and interactions • Fidelity Estimation Perspectives (v5)
Summary Estimation Perspectives (v5)
Estimation and Measurement Are Coupled • Estimates provide predicted information to: • Assess product and project feasibility • Evaluate tradeoffs in performance, quality, cost, and schedule • Identify and obtain resources • Prepare plans to coordinate and track work • Measurements provide actual information to: • Verify expectations and detect deviations • Control processes (preserve estimating assumptions, adapt to changes) • Prepare revised estimates • Formulate, validate, and calibrate predictive models • Improve decision making for projects and businesses • Help the business adapt to changing conditions Estimation Perspectives (v5)
Recurring Themes • Estimation is a continuing process • Accuracy usually increases with time (“learning curve”) • You get what you pay for at any particular time • Perfectly accurate estimates are impossible (and are not needed!) • A little, good data goes a long way (90/10 rule) • There are never enough resources (time, money) • Use Goal – Question – Measurement to choose • Precise definitions are essential (e.g., “line of code” and “defect”) • Some quantities are harder to estimate than others Estimation Perspectives (v5)
Relative Estimation Difficulty Increasing Difficulty • Project Cost • Product Size • Project Effort • Project Schedule • Product Performance • Product Quality • Process Performance Estimation Perspectives (v5)
References (1 of 2) Estimation Perspectives (v5)
References (2 of 2) Estimation Perspectives (v5)