Download
1 / 10
100 likes | 130 Vues
Investigating the connections between precipitation levels and their impact on surface water and groundwater in different areas of North Carolina, particularly in light of recent drought conditions. Preservice teachers will analyze data to identify patterns and draw data-supported conclusions.

E N D
Exploring Water in North Carolina Sarah Carrier
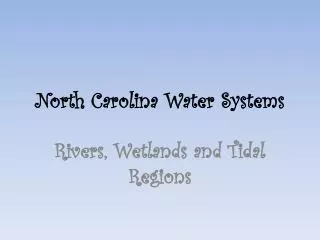
Research Focus • How does precipitation impact both surface water and groundwater in various areas of the state? • I want preservice teachers to explore the connections between the precipitation levels that impact the surface water and groundwater levels.
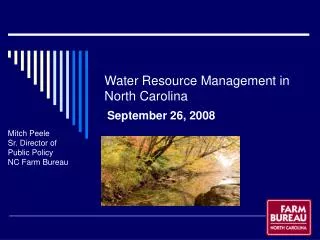
Context: • This is a timely question in North Carolina because of the recent drought conditions in the state. North Carolina’s drinking water is mostly surface water but ground water stores are also a crucial source of water in the state.
Method • Precipitation data, surface water flow, and ground water levels over a recent 3 year period used to compare relationships. • I will guide preservice teachers to the data locations and provide a base question to find patterns that explore relationships between rainfall, surface, and ground water levels. I will ask them to examine the data and draw data-supported conclusions.
Data Summary: • http://tinyurl.com/9b6gcq • http://nc.water.usgs.gov/realtime/real_time_tar_pamlico.html • Mar 2007 744 (100%) 8.5 • Apr 2007 719 (99.9%) 9.4 • May 2007 742 (99.7%) 6.9 • Jun 2007 718 (99.7%) 6.5 • Jul 2007 744 (100%) 4.8 • Aug 2007 744 (100%) 1.9 • Sep 2007 720 (100%) 2.8 • Oct 2007 744 (100%) 12.4 • Nov 2007 720 (100%) 1.8 • Dec 2007 744 (100%) 10.6 • Jan 2008 743 (99.9%) 2.3 • Jan 2009 139 (18.7%) 2.7
Data Summary • The results will allow preservice teachers to find evidence of drought conditions based on rainfall and the impact of drought and precipitation on surface water and ground water.
Conclusion • The data will illustrate the clear relationships between rainfall and water, relating to water supply in the state. Water has been described as the most valuable and threatened natural resource in the world.
Implications • With more time I would correlate the geology of the various regions of the state with the groundwater flow levels.
Assessment • My assessment will evaluate preservice teachers’ use of the data to analyze the patterns and correlations of the rainfall, surface water, and ground water levels. • I expect them to prepare a data-supported relationship (or not) between the three, connecting with drought conditions of the last 3 years.
Educator Implications • This Data-Mining activity would be frustrating for my students because of their limited experience with surface and ground water data. • My modifications will include providing locations for data sources and sparking interest with water cycle activities in class.