Chapter 5 Image Restoration
Chapter 5 Image Restoration. 國立雲林科技大學 電子工程系 張傳育 (Chuan-Yu Chang ) 博士 Office: ES 709 TEL: 05-5342601 ext. 4337 E-mail: chuanyu@yuntech.edu.tw. Chapter 5 Image Restoration. Image Degradation/Restoration Process


Chapter 5 Image Restoration
E N D
Presentation Transcript
Chapter 5Image Restoration 國立雲林科技大學 電子工程系 張傳育(Chuan-Yu Chang ) 博士 Office: ES 709 TEL: 05-5342601 ext. 4337 E-mail: chuanyu@yuntech.edu.tw
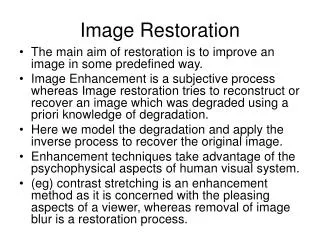
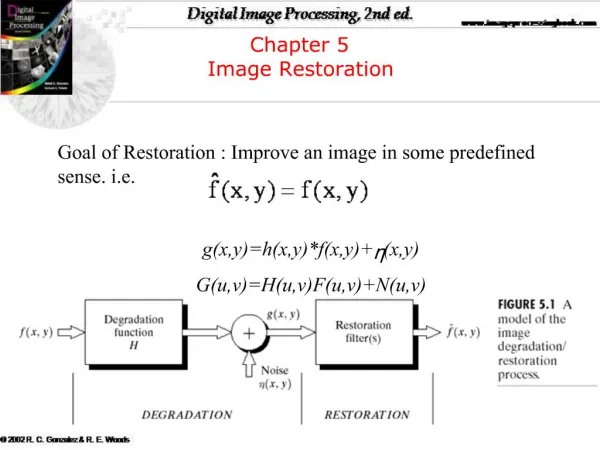
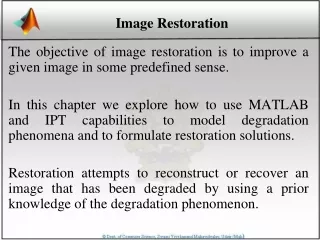
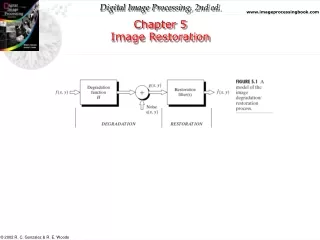
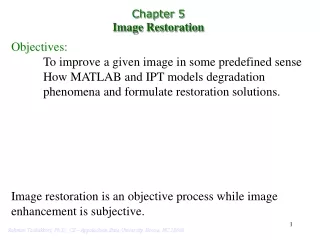
Chapter 5 Image Restoration • Image Degradation/Restoration Process • The objective of restoration is to obtain an estimate of the original image. • will be close to f(x,y). Restoration的目的在於獲得原始影像的估計影像,此估計影像應儘可能的接近原始影像。
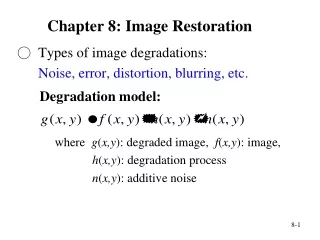
Image Degradation/Restoration Process • The degraded image is given in the spatial domain by • The degraded image is given in the frequency domain by Degradation function (5.1-1) noise (5.1-2)
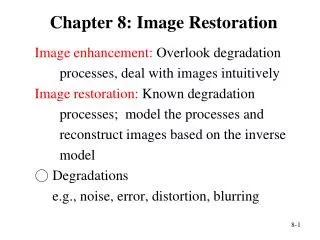
Noise Models: Some Important Probability Density Functions • The principal sources of noise • Image acquisition • transmission • Gaussian noise (normal noise) • Rayleigh noise • Erlang (Gamma) noise
Noise Models • Exponential noise • Uniform noise • Impulse (salt and pepper) noise
Some important probability density function 偏離原點的位移,向右傾斜
Example 5.1Sample noisy images and their histograms • 下圖為原始影像,將在此圖中加入不同的雜訊。
Example 5.1 (cont.) Sample noisy images and their histograms
Periodic Noise • Periodic Noise • Arises typically from electrical or electromechanical interference during image acquisition. • It can be reduced via frequency domain filtering. • Estimation of Noise Parameters • Estimated by inspection of the Fourier spectrum of the image. • Periodic noise tends to produce frequency spikes that often can be detected by visual analysis. • From small patches of reasonably constant gray level. • The heights of histogram are different but the shapes are similar.
Example 影像遭受sinusoidal noise的破壞 有規則性的亮點 影像的spectrum
Fig 5.4(a-c)中的某小塊影像的histogram Histogram的形狀幾乎和Fig4(d,e,k)的形狀一樣但高度不同。
Periodic Noise • The simplest way to use the data from the image strips is for calculating the mean and variance of the gray levels. • The shape of the histogram identifies the closest PDF match. (5.2-15) (5.2-16)
Restoration in the presence of noise only-spatial filtering • Degradation present in an image is noise • The noise terms (h(x,y),N(u,v)) are unknown, so subtracting them from g(x,y)or G(u,v)is not a realistic option. • In periodic noise,it is possible to estimate N(u,v) from the spectrum of G(u,v).
Mean Filter • Arithmetic mean filter • Let Sxy represent the set of coordinates in a rectangular subimage windows of size mxn, centered at point (x,y). • The arithmetic mean filtering process computes the average value of the corrupted image g(x,y) in the area defined by Sxy. • This operation can be implemented using a convolution mask in which all coefficients have value 1/mn. • Noise is reduced as a result of blurring
Mean Filter (cont.) • Geometric mean filter • Each restored pixel is given by the product of the pixels in the subimage window, raised to the power 1/mn. • A geometric mean filter achieves smoothing comparable to the arithmetic mean filter, but it tends to lose less image detail in the process.
Example 5.2Illustration of mean filters 被平均值0,變異數400的加成性高斯雜訊破壞的結果
Restoration in the presence of noise only-spatial filtering • Harmonic mean filter • Contra-harmonic mean filter 可濾除salt noise, 但對pepper noise則失敗 若 Q>0 可濾除pepper noise, 若 Q<0 可濾除salt noise, 若 Q=0 為算數平均 若 Q=-1為Harmonic mean
被機率0.1的pepper雜訊破壞的結果 被機率0.1的salt雜訊破壞的結果 Chapter 5 Image Restoration The positive-order filter did a better job of cleaning the background. In general, the arithmetic and geometric mean filters are well suited for random noise. The contraharmonic filter is well suited for impulse noise
Results of selecting the wrong sign in contra-harmonic filtering The disadvantage of contraharmonic filter is that it must be known whether the noise is dark or light in order to select the proper sign for Q. The result of choosing the wrong sign for Q can be disastrous. 在contra-harmonic filter中選取錯誤正負號所導致的結果
Order-Statistics Filters • The response of the order-statistics filters is based on ordering (ranking) the pixels contained in the image area encompassed by the filter. • Median filter • Replaces the value of a pixel by the median of the gray levels in the neighborhood of that pixel. • Medial filter provide excellent noise-reduction capabilities, with considerably less blurring than linear smoothing filters of similar size. • Median filters are particularly effective in the presence of both bipolar and unipolar impulse noise. (5.3-7)
Order-Statistics Filters (cont.) • Max filter • This filter is useful for finding the brightest points in an image. • It reduces pepper noise • Min filter • This filter is useful for finding the darkest points in an image • It reduces salt noise. 可濾除pepper noise (5.3-8) (5.3-9) 可濾除salt noise
Order-Statistics Filters (cont.) • Midpoint filter • This filter works best for randomly distributed noise, such as Gaussian or uniform noise. • Alpha-trimmed mean filter • We delete the d/2 lowest and the d/2 higest gray-level values of g(s,t) in the neighborhood Sxy. (5.3-10) (5.3-11) 先刪除0.5d最大與最小的灰階值,再求剩下的灰階平均值 當d=0,則為mean filter 當d=(mn-1)/2時,為median filter
Result of one pass with a median filter of size 3x3, several noise points are still visible. Example 5.3Illustration of order-statistics filters Image corrupted by salt and pepper noise with probabilities Pa=Pb=0.1 Result of processing (b) with median filter again Result of processing (c) with median filter again
Example 5.3Illustration of order-statistics filters Result of filtering with a min filtering Result of filtering with a max filtering
Example 5.3 Illustration of order-statistics filters Result of filtering with a arithmetic mean filter Result of filtering with a geometric mean filter Result of filtering with a median filter Result of filtering with a alpha-trimmed mean filter
Adaptive Filter • Adaptive Filter • The behavior changes based on statistical characteristics of the image inside the filter region defined by the m x n rectangular windows Sxy. • The price paid for improved filtering power is an increase in filter complexity. • Adaptive, local noise reduction filter • The mean gives a measure of average gray level in the region. • The variance gives a measure of average contrast in that region. • The response of the filter at any point (x,y) on which the region is centered is to be based on four quantities: • g(x,y): the value of the noisy image. • The variance of the noise corrupting f(x,y) to form g(x,y) • mL, the local mean of the pixels in Sxy. • The local variance of the pixels in Sxy.
The only quantity that Needs to be known Adaptive local noise reduction filter • The behavior of the filter to be as follows: • If the variance of g(x,y) is zero, the filter should return simply the value of g(x,y). • If the local variance is high relative to the variance of g(x,y) , the filter should return a value close to g(x,y). • If the two variances are equal, return the arithmetic mean value of the pixels in Sxy. • An adaptive expression for obtaining estimated f(x,y) based on these assumptions may be written as (5.3-12)
Example 5.4 Illustration of adaptive, local noise-reduction filtering Arithmetic mean 7*7 Gaussian noise geometic mean 7*7 Adaptive filter
Adaptive median filter • Adaptive median filtering can handle impulse noise, it seeks to preserve detail while smoothing nonimpulse noise. • The adaptive median filter changes the size of Sxy during filter operation, depending on certain conditions. • Consider the following notation: • Zmin: minimum gray level value in Sxy. • Zmax: maximum gray level value in Sxy. • Zmed: median of gray levels in Sxy. • Zxy: gray level at coordinates (x,y). • Smax: maximum allowed size of Sxy.
Adaptive median filter (cont.) • The adaptive median filtering algorithm • Level A: A1=zmed-zminA2=zmed-zmax if A1>0 and A2<0, goto level B else increase the window sizeif window size<=Smax, repeat level A else output zxy • Level B: B1=zxy-zmin B2=zxy-zmax if B1>0 and B2 <0, output zxy else output zmed 判斷zmed是否為impulse noise
Adaptive median filter (cont.) • The objectives of the adaptive median filter • Remove the slat-and-pepper noise • Preserve detail while smoothing nonimpulse noise • Reduce distortion • The purpose of level A is to determine in the median filter output, zmed is an impulse or not.
Example 5.5 Illustration of adaptive median filtering Result of adaptive median filtering with Smax=7 Corrupted by salt-and pepper noisewith probabilities Pa=Pb=0.25 Result of filtering with a 7x7 median filter Preserved sharpness and detail The noise was effectively removed, the filter caused significant loss of detail in the image
Periodic Noise Reduction by Frequency Domain Filtering • Bandreject Filter • Remove a band of frequencies about the origin of the Fourier transform. (5.4-1) Ideal Bandreject filter N order Butterworth filter (5.4-2) Gaussian Bandreject filter (5.4-3)
Periodic Noise Reduction by Frequency Domain Filtering (cont.)
Periodic Noise Reduction by Frequency Domain Filtering (cont.) Image corrupted by sinusoidal noise Butterworth bandreject filter of order 4
Periodic Noise Reduction by Frequency Domain Filtering (cont.) • Bandpass Filters • A bandpass filter performs the opposite operation of a bandreject filter. • The transfer function Hbp(u,v) of a bandpass filter is obtained from a corresponding bandreject filter with transfer function Hbr(u,v) by (5.4-4)
Periodic Noise Reduction by Frequency Domain Filtering (cont.) • Bandpass filtering is quit useful in isolating the effect on an image of selected frequency bands. 以帶通濾波器所獲得的圖5.16(a)影像的雜訊圖樣 • This image was generated by • Using Eq(5.4-4) to obtain the bandpass filter. • Taking the inverse transform of the bandpass-filtered transform
Periodic Noise Reduction by Frequency Domain Filtering (cont.) 因為對稱性的關係 • Notch Filters • Rejects frequencies in predefined neighborhoods about a center frequency. • Due to the symmetry of the Fourier transform, notch filters must appear in symmetric pairs about the origin (5.4-5) (5.4-6) (5.4-7)
Periodic Noise Reduction by Frequency Domain Filtering (cont.) • order n Butterworth notch filter • Gaussian notch reject filter • These three filters become highpass filters if u0=v0=0. (5.4-8) (5.4-9)
Periodic Noise Reduction by Frequency Domain Filtering (cont.) Ideal notch order 2 Butterworth notch filter Gaussian notch filter 若u0=v0=0,上述三種濾波器,則退化成高通濾波器
Periodic Noise Reduction by Frequency Domain Filtering (cont.) • Notch pass filters • We can obtain notch pass filters that pass the frequencies contained in the notch areas. • Exactly the opposite function as the notch reject filters. • Notch pass filters become lowpass filters when u0=v0=0. (5.4-10)
Periodic Noise Reduction by Frequency Domain Filtering (cont.) 佛羅里達州和墨西哥灣的衛星影像 (存在水平掃描線) Spectrum image Notch filter 空間域的雜訊影像
Periodic Noise Reduction by Frequency Domain Filtering (cont.) • Optimal Notch filtering • Clearly defined interference patterns are not common. • Images obtained from electro-optical scanner are corrupted by coupling and amplification of low-level signals in the scanners’ electronic circuitry. • The resulting images tend to contain significant, 2D periodic structures superimposed on the scene data.
Periodic Noise Reduction by Frequency Domain Filtering (cont.) • Image of the Martian terrain taken by the Mariner 6 spacecraft. • The interference pattern is hard to detect. • The star-like components were caused by the interference, and several pairs of components are present. • The interference components generally are not single-frequency bursts. They tend to have broad skirts that carry information about the interference pattern.
Periodic Noise Reduction by Frequency Domain Filtering (cont.) • Optimal Notch filtering minimizes local variances of the restored estimate image. • The procedure contains three steps: • Extract the principal frequency components of the interference pattern. • Subtracting a variable, weighted portion of the pattern from corrupted image.
Periodic Noise Reduction by Frequency Domain Filtering (cont.) • The first step is to extract the principal frequency component of the interference pattern • Done by placing a notch pass filter, H(u,v) at the location of each spike. • The Fourier transform of the interference noise pattern is given by the expressionwhere G(u,v) denotes the Fourier transform of the corrupted image.
Periodic Noise Reduction by Frequency Domain Filtering (cont.) • Formation of H(u,v) requires considerable judgment about what is or is not an interference spike. • The notch pass filter generally is constructed interactively by observing the spectrum of G(u,v) on a display. • After a particular filter has been selected, the corresponding pattern in the spatial domain is obtained from the expression
Periodic Noise Reduction by Frequency Domain Filtering (cont.) • Because the corrupted image is assumed to be formed by the addition of the uncorrupted image f(x,y) and the interference, if h(x,y) were know completely, subtracting the pattern from g(x,y) to obtain f(x,y) would be a simple matter. • This filtering procedure usually yields only an approximation of the true pattern. • The effect of components not present in the estimate of h(x,y) can be minimized instead by subtracting from g(x,y) a weighted portion of h(x,y) to obtain an estimate of f(x,y). • The function w(x,y) is to be determined, which is called as weighting or modulation function. • The objective of the procedure is to select this function so that the result is optimized in some meaningful way. (5.4-13)
Periodic Noise Reduction by Frequency Domain Filtering (cont.) • To select w(x,y) so that the variance of the estimate f(x,y) is minimized over a specified neighborhood of every point (x,y). • Consider a neighborhood of size (2a+1) by (2b+1) about a point (x,y), the local variance can be estimated aswhere (5.4-14) (5.4-15)