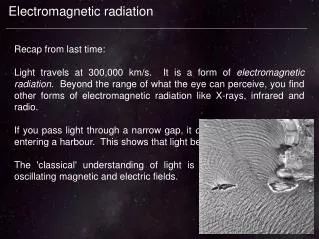
Electromagnetic Radiation
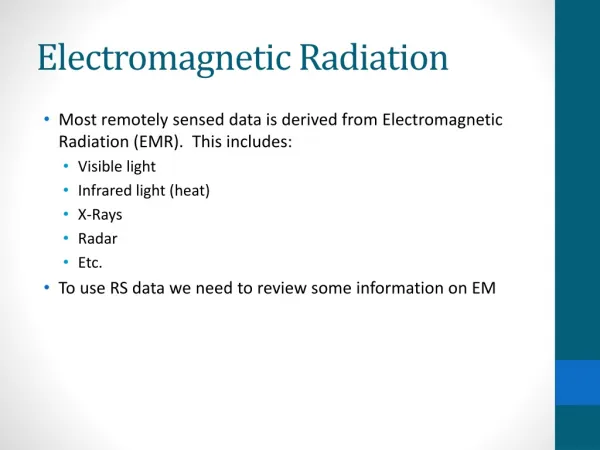
Electromagnetic Radiation. Most remotely sensed data is derived from Electromagnetic Radiation (EMR). This includes: Visible light Infrared light (heat) X-Rays Radar Etc. To use RS data we need to review some information on EM. Electromagnetic Radiation. Electromagnetic Energy.

Electromagnetic Radiation
E N D
Presentation Transcript
Electromagnetic Radiation • Most remotely sensed data is derived from Electromagnetic Radiation (EMR). This includes: • Visible light • Infrared light (heat) • X-Rays • Radar • Etc. • To use RS data we need to review some information on EM
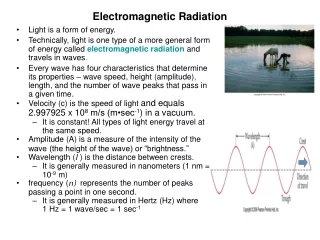
Electromagnetic Energy Wave Theory - c =𝜆 x 𝜐 Speed of Light (c) = wavelength x frequency (𝜆 x 𝜐) c = 3 x 10⁸ m/sec (the speed of light) = 186,000 miles/sec Wavelength (𝜆) – the distance from one wave peak (or crest) to the next is the wavelength Frequency (𝜐)- the number of peaks passing a fixed point in a space per a given time unit
Scattering In the absence of particles and scattering the sky would appear black. • At sunrise and sunset the sunlight travels a longer distance through the atmosphere • With the longer path the scatter and absorption is of the short (blue) wavelengths is so complete we only see the longer wavelengths of light, the red and orange Source: Principles of Remote Sensing (Tempfli et al.)
Impact of Atmospheric Interaction Clouds! Landsat 8 imagery of the North Coast
Impact of Atmospheric Interaction Cloud Shadows
Energy Interaction with the Earth’s Surface The proportion of energy reflected, absorbed and transmitted will vary depending on the surface material and condition The proportion of energy reflected, absorbed and transmitted will also vary at different wavelength • Absorption(A) occurs when radiation (energy) is absorbed into the target • Transmission(T) occurs when radiation passes through a target. • Reflection(R) occurs when radiation "bounces" off the target and is redirected
Energy Interaction with the Earth’s Surface The proportion of energy reflected, absorbed and transmitted will vary depending on the surface material and condition For example: • Vegetation and soils can reflect approximately 30-50% of the incident energy (across the entire EM spectrum) • Water on the other hand reflects only 10% of incident energy. It reflects most of this in the visible range, minimal in the NIR and beyond 1.2 mm (mid-infrared) all energy is absorbed.
Reflectance Necessary to consider viewing geometry and illumination geometry Basically the azimuth angle, viewing angle, and solar elevation
Radiance vs. Reflectance The atmosphere affects radiance in two ways: • Reduces (or attenuates) the energy • Atmosphere itself is a reflector, adding scatter, “path radiance” to the signal detected by the sensor.
Spectral Reflectance Curves Spectral Reflectance Curves for three materials shown in the visible and infrared wavelengths
Spectral Reflectance Curve - Vegetation Infrared reflection
Spectral Reflectance Curve - Vegetation • As a plant stops or reduces chlorophyll production, it absorbs less in the red bands (therefore reflects more red) producing yellow color of dying vegetation. • Red color of some leaves produced by carotenoids which are always present but usually masked by chlorophyll
Spectral Reflectance - Vegetation • Remote sensed imagery can be used to detect stressed or diseased plants • High NIR reflectance / Low visible reflectance = Healthy • Low NIR reflectance / High visible reflectance = Unhealthy
NDVI • The differences in spectral reflectance can be used to compute a variety of “Indexes” for specific phenomenon. • For example, the “Normalized Difference Vegetation Index” or NDVI, attempts to quantify how much green vegetation is within each pixel of a satellite image. It uses the “red-edge” between the red bands and near-IR bands with the following formula: • Where: • NIR=Near Infrared band • VIS=visible, typically red band
Ground Truthing • How do you know if something derived from satellite data is correct? • Ground-truthing is when you validate your remotely sensed data with data from the “ground”. • Ground-truthing varies with the type of data and your goals. • Examples: • Measuring vegetation reflectance and comparing it with satellite data • Performing object recognition and comparing with the actual objects on the ground www.asdi.com