Download
1 / 1
10 likes | 152 Vues
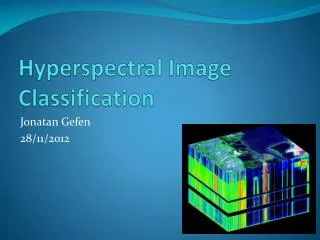
Segmentation and Classification of Hyperspectral Images. Alex Chen, Andrea Bertozzi Department of Mathematics, UCLA. Overview of Hyperspectral Images. Hyperspectral Signal Reconstruction.

E N D
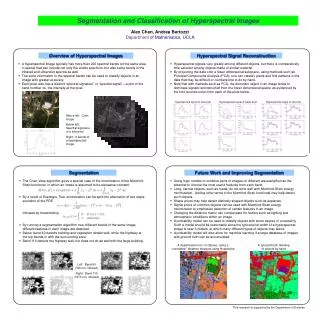
Segmentation and Classification of Hyperspectral Images Alex Chen, Andrea Bertozzi Department of Mathematics, UCLA Overview of Hyperspectral Images Hyperspectral Signal Reconstruction • A hyperspectral image typically has more than 200 spectral bands (of the same area in space) that can include not only the visible spectrum, but also some bands in the infrared and ultraviolet spectra as well. • The extra information in the spectral bands can be used to classify objects in an image with greater accuracy. • Each pixel also has a distinct “spectral signature” or “spectral signal”—a plot of the band number vs. the intensity at the pixel. • Hyperspectral signals vary greatly among different objects, but there is comparatively little variation among objects made of similar material. • By projecting the data onto a lower dimensional subspace, using methods such as Principal Components Analysis (PCA), one can classify pixels and find patterns in the data that may be difficult or cumbersome to do by hand. • Note that with methods such as PCA, the dominant object in an image tends to dominate signals reconstructed from the lower dimensional space, as evidenced by the first reconstruction from each of the plots below. Hyperspectral signal of tree pixel Hyperspectral signal of water pixel Hyperspectral signal of car pixel Above left: Color image Below left: Spectral signature of a tree pixel Right: 6 bands of a hyperspectral image Segmentation Future Work and Improving Segmentation • The Chan-Vese algorithm gives a special case of the minimization of the Mumford-Shah functional, in which an image is assumed to be piecewise constant. • By a result of Esedoglu, Tsai, minimization can be split into alternation of two steps: evolution of the PDE followed by thresholding: • By running a segmentation algorithm over different bands of the same image, different features in each image are detected. • Below, band 60 detects building and vegetation details well, while the highway at the top blends in with the surrounding area. • Band 110 detects the highway well, but does not do as well with the large building. • Using logic models to combine parts of images on different wavelengths has the potential to choose the most useful features from each band. • Long, narrow objects, such as roads, do not work well with Mumford-Shah energy minimization. Adding other terms in the Mumford-Shah functional may help detect such objects. • Shape priors may help detect distinctly shaped objects such as airplanes. • Signal priors of common objects can be used with Mumford-Shah energy minimization to emphasize detection of certain features in an image. • Changing the distance metric can compensate for factors such as lighting and atmospheric conditions within an image. • A probability model can be used to classify objects with some degree of uncertainty. Such a model should be reasonable since the typical pixel width of a hyperspectral image is near 3 meters, at which many different types of objects may blend. • A probability model will also allow for machine learning if a large database of images with ground truth can be accumulated. A classification into 10 classes, using a “correlation” distance measure using Hypercube A “ground truth” labeling of objects by hand Left: Band 60 (796 nm, infrared) Right: Band 110 (1673 nm, infrared) This research is supported by the Department of Defense.