Download
1 / 16
160 likes | 180 Vues
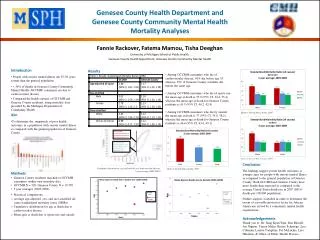
This study analyzes the immunization patterns in Genesee County using geographic information systems (GIS) and cluster analysis. The aim is to determine areas with low immunization rates and identify potential factors contributing to immunization gaps. The study population includes children aged 19-35 months, and various childhood vaccines are considered. The results provide insights for targeted interventions and public health strategies.

E N D
Geographic analysis of immunization patterns in Genesee County Kyle S. Enger, MPH Vaccine-Preventable Disease Epidemiologist Division of Immunization Michigan Dept. of Community Health (MDCH)
Data source: MCIR(Michigan Care Improvement Registry) • Operational since 1998 • Birth-to-death immunization registry • < 20 y age restriction removed June 2006 • ~95% of providers participate • Part of CDC’s IIS sentinel site project • Michigan’s population is large • 10 million people • 130,000 births/year
Methods: Geocoding • MCIR receives ‘responsible party’ addresses from birth certificate or clinicians • Address is converted to geographic coordinates by the MI Dept. of Human Services (DHS) using Postalsoft • ~85% of addresses yield good coordinates • Very easy to view using GIS (ArcView)
Methods: Density mapping • Converts point data to a continuous surface • Similar to a drip castle – each point gets a drip, and drips can stack on each other • ‘High’ areas are bright; ‘low’ areas are dark • Brightness=kids/mile2 • ArcGIS Spatial Analyst
Methods: Cluster analysis • Determines where a factor is more common than population would suggest • Generates circular clusters; provides relative risk & P-value for each cluster • SaTScan (free software)
Study population • Children with a Genesee County address & geographic coordinates: • aged 19-35 months on 28 Feb. 2007 • on record in MCIR • Density maps and cluster analysis: • For various childhood vaccines • DTaP, MMR, polio, Hib, hep. B, varicella, PCV7 • Completely unimmunized • Partially immunized
DTaP clustering For illustration only. Cluster locations & sizes have been randomly changed.
PCV7 clustering For illustration only. Cluster locations & sizes have been randomly changed.
Acknowledgements Questions? Mark Valacak, Sherry Wood, & Fatema Mamou, Genesee County Health Dept. Kevin Czubachowski, Mich. Dept. Comm. Health Kyle Enger engerk@michigan.gov
SaTScan settings • Max cluster size: 50% of population • Clusters of high RR only • Bernoulli model (1/0) • (immunized/unimmunized) • No pairs of centers both in each other’s clusters
Density map settings • Density type: kernel • Cell size: 50m • Kernel radius: 1 km • Output area units: kids/mile2 or iz./mile2 • Color steps: Factor of 1.67